


Here is what has actually happened over the past 2 years:
Aug 27 - The latest S&P / Case-Shiller® Home Price Index® numbers were published this Tuesday.
The new report covers home sales during the period April to June 2024. This means the typical home sale closed in mid May, more than 3 months ago. Please remember that Case-Shiller data is fairly old, even on the day it is released.
All 20 cities show rising prices for last month.
Comparing with the previous month's series we see the following changes:
Detroit +1.13%
Chicago +0.95%
Las Vegas +0.84%
Cleveland +0.76%
Atlanta +0.72%
Boston +0.68%
Miami +0.66%
San Diego +0.65%
Minneapolis +0.63%
Los Angeles +0.61%
Seattle +0.59%
Washington +0.58%
New York +0.56%
Charlotte +0.48%
Phoenix +0.42%
Dallas +0.39%
Denver +0.25%
Tampa +0.21%
Portland +0.13%
San Francisco +0.07%
Phoenix has risen from 19th to 15th places over the last month. The national average was +0.47% so Phoenix prices rose slightly less than the national average.
The North, Las Vegas and Atlanta remain strongest.
Comparing year over year, we see the following changes:
New York +9.0%
San Diego +8.7%
Las Vegas +8.5%
Los Angeles +8.2%
Chicago +7.0%
Detroit +7.0%
Miami +6.9%
Cleveland +6.7%
Seattle 6.7%
Boston +6.6%
Charlotte +6.4%
Washington +6.0%
Atlanta +5.1%
San Francisco +4.3%
Phoenix +3.7%
Tampa +3.1%
Dallas +2.3%
Minneapolis +2.0%
Denver +1.9%
Portland +0.8%
Phoenix dropped one place to 15th, and is still stuck in the bottom half on a year over year basis. All 20 of the cities are again showing positive price movement from one year ago with Denver and Portland once again at the bottom. Las Vegas is looking strong in both tables.
The national average is +5.4% year over year. Phoenix is below that percentage, and in a similar situation to the last four months.
Aug 25 - 2024 has seen a rebound in the number of single-family building permits issued in Maricopa and Pinal counties.
So far (until the end of July) we have counted 18,498 single-family units which is up more than 40% from the same period last year. However it is not quite up to the booming levels of 2021 and 2022 when we counted 21,796 and 19,748 respectively. The re-sale market has been much weaker than the new home market and year-to-date closing volumes are down from 2023 - 45,937 as of the end of June 2024, which is down 4% from the same period last year. We do not often see the new home and re-sale markets so disconnected from each other.
Homebuilders are clearly optimistic about the market, especially given the Federal Reserve positioning on reduced interest rates. Many of the publicly traded developers saw there stock prices hit all-time highs over the last week.
Permits are up 39% in Maricopa county and up 43% in Pinal county. They are also up almost 38% for Arizona's 13 other counties.
The year-to-date permit counts by location are as follows:
Unincorporated Pinal County 2,849
Phoenix 2,331
Surprise 2,039
Buckeye 1,484
Unincorporated Maricopa County 1,205
Queen Creek 1,112
Peoria 1,098
Goodyear 1,092
Maricopa 883
Casa Grande 722
This list is very different from the re-sale market. Note that Mesa, Glendale, Scottsdale, Gilbert and Chandler didn't make the top 10.
The failure of San Tan Valley to incorporate means we have an extremely large number of new homes going into locations that are not managed by a city or town, but just the county administration. There is now a renewed effort to incorporate and a vote is scheduled for later this year to determine if this effort can proceed.
Florence is growing fast and is now receiving more permits than Gilbert and threatening to overtake Scottsdale.
Aug 22 - Here is our latest table of Cromford® Market Index values for the single-family markets in the 17 largest cities
We are seeing more positive signs from a seller's perspective. There are 9 cities showing an increase in their Cromford® Market Index over the past month, up from 8 last week. We have 8 cities showing a decrease. That is a small majority going up and this is the first time we seen this situation since May 9.
The change is still painfully slow but it is real. The trend has reversed but is yet to gather any significant momentum.
The average change in CMI over the past month is +0.7%, our first positive change since May 23. Last week we saw -0.1%.
The market is starting to improve for sellers overall and I hope buyers took good advantage of their opportunity to negotiate harder over the last 3 months.
Cave Creek, Paradise Valley, Buckeye and Fountain Hills are showing the largest percentage gains. In addition, Scottsdale, Gilbert, Maricopa, Goodyear and Peoria are all up over the last month. The largest declines are still concentrated in the Southeast Valley (Tempe, Chandler and Mesa), but Avondale has weakened substantially too..
9 out of 17 cities remain seller's markets over 110. We have 3 cities that are balanced, while the remaining 5 are buyer's markets. 3 cities still remain over 140 while 3 remain under 75.
Aug 20 - Another way in which we can get distortions in the pricing averages is when the mix between Pinal County and Maricopa County changes dramatically.
Comparing April with July 2024, the number of closed sales in Pinal County dropped by only 0.7% from 877 to 871. But the closed sales in Maricopa County fell by more than 15% from 5,737 to 4,876. Because Pinal is much less expensive than Maricopa on average, the swerve in favor of Pinal brought pricing measurements substantially lower. The average $/SF in Pinal fell just 3.1% between April and July, but 6.9% in Maricopa and 7.2% for both counties combined.
These mix effects can be confusing and tend to happen during the third quarter of each year. The overall average drops sharply, but the fall in individual subsegments tends to be less dramatic.
In Pinal County, a much higher percentage of overall sales are new builds. Despite being brand new, these homes have a low average price per sq. ft because more of them are further out on land that was purchased relatively cheaply by the developer. We can see from the Tableau charts on Cromford® Public that new homes are cheaper than resales on a price per sq. ft. basis. This seems counter-intuitive, and it is not the case when you look at a small area. But taken across Greater Phoenix as a whole, new home $/SF is clearly lower then re-sale $/SF. This is because the distribution of new homes is not uniform. Most of them are going up on much cheaper lots in locations with more affordable pricing.
We have to put up with these distortions in the market between June and August and things don't really get back to the normal mix until the second half of September.
Aug 17 - We have mentioned many times that the high-end market tends to drop off substantially during the Summer months, causing all sorts of distortion in market averages, especially those related to price.
To illustrate how this happens, let us look at the figures for April versus July and compare the Northeast Valley with the rest of the Greater Phoenix market. We know that the bulk of luxury homes are situated in the Northeast Valley, which we will define as Carefree, Cave Creek, Fort McDowell, Fountain Hills, Paradise Valley, Rio Verde and Scottsdale. We are going to add Phoenix 85016 and 85018 and exclude Scottsdale 85257.
For this area the April single-family detached sales count was 662 and the July count was 440. This represents a unit volume decline of almost 34%. The average price per square foot also fell from $558.56 to $505.70, a decline of 9.5%.
For the rest of Greater Phoenix excluding the area defined above, the single-family detached sales count for April was 4,631 and the average $/SF was $262.36. In July the sales count was 4,267 and the $/SF was $254.26. So the sales declined only 8% and the $/SF only went down by 3%.
When we look at Greater Phoenix as a whole we see the weak contribution from luxury sales dragging down the $/SF all the way from $313.17 to $289.28, a drop of 7.6%, more than twice the decline seen in the market outside the Northeast.
Naturally we expect high-end sales to recover once the temperatures cool off, which will mean their contribution to the average $/sf will grow and average pricing will probably recover its stability.
Aug 15 - Here is our latest table of Cromford® Market Index values for the single-family markets in the 17 largest cities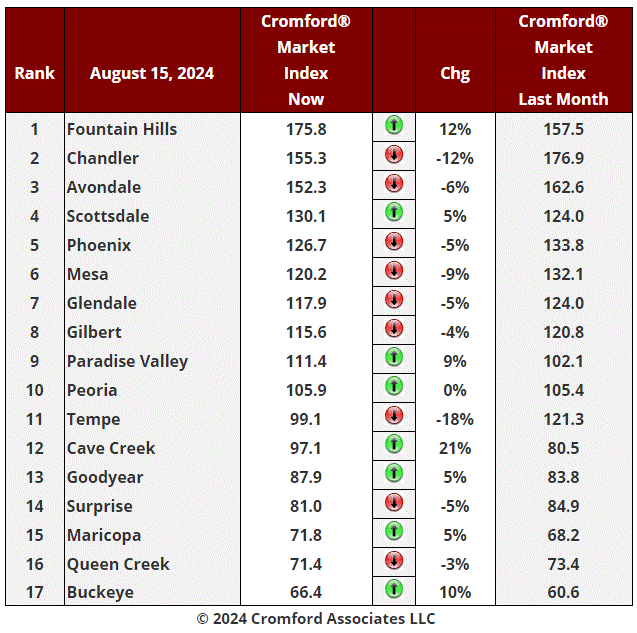
Aug 10 - The following observation was written in response to an interesting question from our long-term subscriber John Gluch.
Days on Market is a very flawed measure that I do not pay very much attention to. There is little relationship between DOM and the Cromford® Market Index, which is designed to be a leading measure. DOM is a trailing measure and often points in the wrong direction for a long time compared with other indicators.
There are a couple of big reasons for DOM being less than useful:
1. Many agents will perform contortions to try to get their DOM counts reset to zero and the MLS has struggled to counter those measures in an evolutionary tug of war.
2. A significant percentage of agents place their listings in Active – UCB status when they get a contract signed. In the distant past this would normally be pending. This causes DOM to continue to accumulate and distorts the measurement in the other direction.
We prefer a different measure which is agent days to contract acceptance. This is shown in a Tableau chart below:
https://cromfordreport.com/member-only/tableau/new-contracts-vs-back-on-market.html
It is still flawed but not nearly as much. The latest number is 36 which is up sharply from 20 just 12 months ago. In fact, it is the highest reading for August since 2014, which was a particularly weak period for housing. This means listings are taking longer to get a contract accepted than in any August in the last 10 years. This may well match your current experience as an agent.
This measure tends to be influenced by seasonality with December and January producing high values, which need to be treated with caution.
When supply and demand are in balance, the CMI is around 100, but this happens much less than you might think. Over the past 24 years, we have tended to be mostly in a seller’s market and when we are not, we often have a buyer’s market. In buyer’s markets DOM values get very high, even well into the hundreds of days. Since we are rarely in a balanced market, sellers experiencing them tend to think they are worse than balanced, because they feel “worse than normal”. They ARE worse than normal because a normal market is unbalanced in favor of sellers. Balance and normal are not the same thing.
The last time we had a CMI below 100 was 4Q 2022. Average DOM for closed listings was then between 51 and 68. Today we are at 67, so in the same ballpark.
DOM for active listings is always much higher than DOM for closed listings because the active listings contain a higher percentage of luxury homes than the closed listings. These luxury homes spend much longer in active status and distort the reading to the upside.
Currently, I think a lot of buyers are in limbo, waiting for mortgage rates to fall further, as that is what all the media pundits are saying will happen later this year.
Aug 8 - Here is our latest table of Cromford® Market Index values for the single-family markets in the 17 largest cities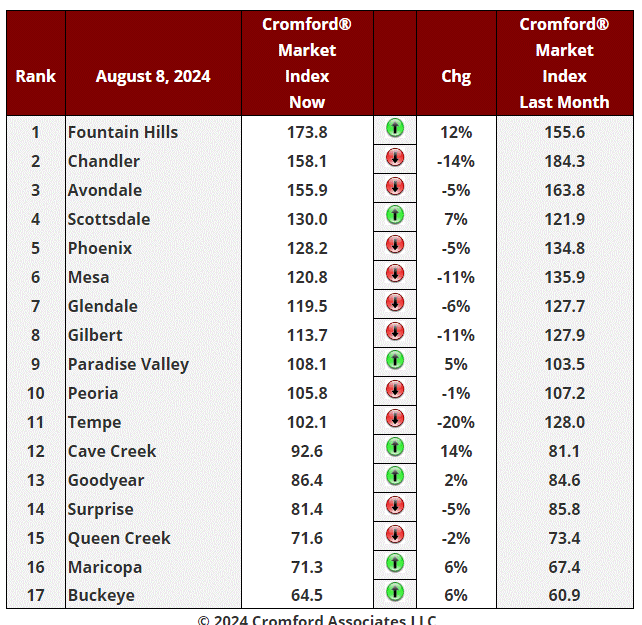
This table is starting to look a lot less negative. We have 7 cities showing an increase in their Cromford® Market Index over the past month, up from 5 last week.
The average change in CMI over the past month is -1.8%, a much smaller decline than the -4.4% we saw last week and continuing a positive trend that started three weeks ago. If we look at the change over the past week, we see an average of +0.4%. That's right - the average CMI went up slightly from August 1 to August 8.
Fountain Hills, Cave Creek, Scottsdale are showing the largest percentage gains, so it seems clear that the top end of the market is leading the resistance against the weaker market. Maricopa, Buckeye, Goodyear and Paradise Valley are all up over the last month. The largest declines are still concentrated in the Southeast Valley (Tempe, Gilbert, Chandler and Mesa). After a long stay at the top, Chandler has weakened dramatically and looks likely to be overtaken by Avondale and fall into third place.
8 out of 17 cities remain seller's markets over 110. We have 4 cities that are balanced, while the remaining 5 are buyer's markets. 3 cities still remain over 140 and Scottsdale is making an attempt to join them.
Aug 6 - Buyer's agent commissions are a hot topic right now (apologies if I am twisting the knife). As I am based in the UK these days, some subscribers might be interested to learn what fees a UK buyer's agent charges in a system where the sellers will never pay for a buyer's agent.
First it must be stated that buyer's agents are rare in the UK. The vast majority of transactions are conducted without the buyer having representation from an agent. They are expected to find a property and negotiate the price all on their own. There are plenty of estate agents, but they only help sellers and they are paid by the sellers from the proceeds of sale. They are clearly motivated to get the highest possible price in the shortest possible time. There are no obligations to disclose defects. From an integrity perspective, seller's agents are respected about as much as used car salespeople and politicians.
However there are some professional buyer's agents. They are generally used by clients who are looking for an expensive property - at least £500,000 and probably over £1 million (about $1,280,000). Their clients may be looking for something hard to find because it is unusual, or they may have no time to look for themselves. This is especially true if they are buying from outside the country. They usually operate in and around London. It is very hard to find a buyer's agent that will cover the more remote areas, such as where I live in County Durham.
It is up to the buyer and their agent to agree their commission. It will probably be different in every case. If I use one example - Henry Pryor & Co., their website states that they offer the following options:
1. A "pocket agent service" for a one-time charge of £1,000 ($1,280) including sales tax (VAT at 20%) - this is for response to questions and advice on how to negotiate with the seller. No active search is conducted.
2. A "buying service" fee as follows:
1. £600 per week pay-as-you-go for as long as it takes
2. A fixed up-front fee of £14,400 even for properties valued at £50 million or more
3. A one-time retainer of £2,400 plus 3% of the purchase price payable.
Henry Pryor discourages clients from using the third option. I can see why. Apart from probably ending up being more costly, it seems patently silly for a buyer's agent to be paid more if the buyer pays a higher price. You want your buyer's agent to be motivated to get the price as low as possible once you have found the desired property. That is one of the fundamental moral problems with the old system where selling agents offer a percentage of the price to a cooperating buyer's agent. The harder they work to negotiate a good deal for the buyer, the less they get paid in commission. You can see why the DOJ has problems with this system.
Important! Henry Pryor operates "dynamic pricing" which means their charges go up when they are very busy and they go down when times are quiet. This is to try to balance supply and demand for their agents (a bit like Uber surge pricing). Fees are documented in writing at the start of the process.
Personally, I think many UK buyers act foolishly if they don't use a buyer's agent, at least for a property over £1 million. The professional advice may prevent you buying a home with a fatal flaw and their negotiation experience means they can almost certainly save you more money than you will be paying in fees, unless you are already a superbly skilled negotiator with extensive real estate experience.
Buyer's agents can often find properties that are not yet on the market. This is extremely hard for buyers to do without an agent.
An advantage of being a buyer's agent in the UK is that your integrity is generally respected by all sides.
I hope this stimulates some ideas for agents in Arizona.
Aug 3 - The affidavits of value have been counted and analyzed for Maricopa County's July filings and here is what we found:
There were 6,360 closed transactions, up 4.6% from 6,081 in July 2023 but down 4.1% from June.
There were 1,378 closed new homes, up 1.9% from 1,352 in July 2023 but down 13% from June.
There were 4,982 closed re-sale transactions, up 5.4% from 4,729 in July 2023 but down 1.3% from June.
The overall median sales price in June was $467,545, up 0.5% from July 2023 but down 1.6% from June..
The re-sale median sales price was $450,000, up 1.1% from July 2023 but down 3.2% from June.
The new home median sales price was $506,240, down 5.1% from July 2023 but up 0.5% from June.
There were 22 working days in July 24 versus 21 in July 23, so the 4.6% rise in closings is more than explained by the 4.8% increase in the number of working days. In a reversal of long-standing trends, new homes grew only 1.9%, while resales grew 5.4%, modestly exceeding the change in working days..
New home market share dropped to 21.7% in July 2024, down from 22.2% a year ago.
Prices were weak for re-sales, down more than 3% from a month earlier. The peak remains $486,000 achieved in May 2022, just before the iBuyers started their liquidation sales.
Overall we see an annual rise in the median sales price of only 0.5%, so well below the rate of inflation. This means the median home is cheaper than a year ago, when adjusted for inflation. The median new home is down more than 5% from a year ago, so cheaper than last year even before adjusting for inflation.
Given that median household incomes have risen substantially over the last year, affordability in Maricopa County has improved, though there is no sign yet of this leading to strengthening demand. It would make sense to assume that potential buyers are waiting for mortgage rates to come down. Recent pronouncements by the Federal Reserve suggest such a change is on the cards in the short-term.
These numbers are for single family and townhouse / condo homes.
Aug 1 - Here is our latest table of Cromford® Market Index values for the single-family markets in the 17 largest cities
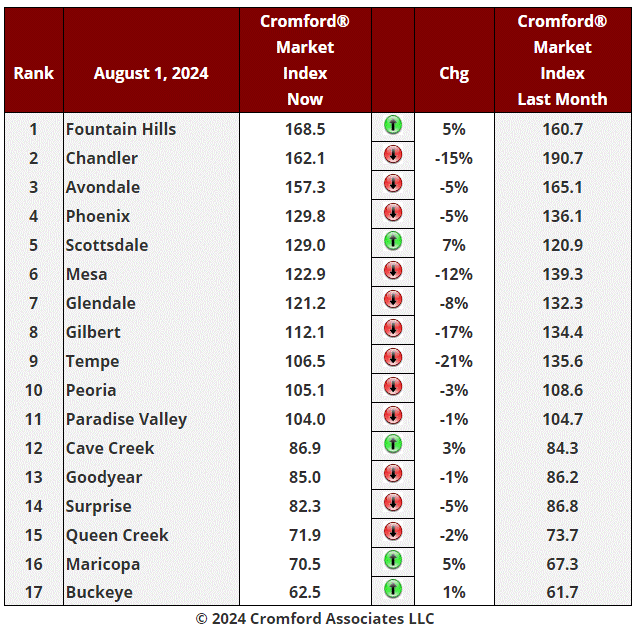
This table is starting to look a little less negative. We have 5 cities showing an increase in their Cromford® Market Index over the past month, up from only 2 last week.
The average change in CMI over the past month is -4.4%, smaller than the -5.4% we saw last week and continuing a positive trend that started a couple of weeks ago.
Scottsdale, Fountain Hills, Maricopa, Cave Creek and Buckeye are the risers while the largest declines are concentrated in the Southeast Valley (Tempe, Gilbert, Chandler and Mesa). After a long stay at the top, Chandler has finally been overtaken by Fountain Hills.
8 out of 17 cities remain seller's markets over 110.. We have 3 cities that are balanced, while the remaining 6 are buyer's markets. 3 cities still remain over 140.
Jul 30 - The latest S&P / Case-Shiller® Home Price Index® numbers were published this Tuesday.
The new report covers home sales during the period March to May 2024. This means the typical home sale closed in mid April, more than 3 months ago. Please remember that Case-Shiller data is fairly old, even on the day it is released.
All 20 cities show rising prices for last month.
Comparing with the previous month's series we see the following changes:
Cleveland +1.75%
Detroit +1.71%
Seattle +1.43%
New York +1.26%
Las Vegas +1.20%
Minneapolis +1.14%
Chicago +1.13%
Washington +1.12%
Atlanta +1.00%
Charlotte +0.99%
Los Angeles +0.98%
Denver +0.87%
Tampa +0.79%
Dallas +0.75%
San Diego +0.72%
San Francisco +0.69%
Miami +0.67%
Boston +0.53%
Phoenix +0.42%
Portland +0.33%
Phoenix has overtaken Portland to climb one place to 19th. The national average was +0.86% so Phoenix prices rose less than half the national average.
Many areas enjoyed exceptionally strong rises, especially in the North and on the Atlantic Coast. Apart from Seattle, the Pacific Coast has slowed down.
Comparing year over year, we see the following changes:
New York +9.4%
San Diego +9.1%
Las Vegas +8.6%
Los Angeles +8.4%
Miami +7.6%
Chicago +7.5%
Cleveland +7.5%
Boston +7.2%
Charlotte +7.2%
Seattle +7.1%
Detroit +6.8%
Washington +6.1%
Atlanta +5.7%
Phoenix +4.4%
San Francisco +4.2%
Tampa +3.3%
Dallas +2.6%
Minneapolis +2.4%
Denver +2.1%
Portland +1.0%
Phoenix stayed at 14th place yet again, and is still stuck in the bottom half on a year over year basis. All 20 of the cities are again showing positive price movement from one year ago with Denver and Portland once again at the bottom. Las Vegas is looking surprisingly strong.
The national average is +5.9% year over year. Phoenix is below that percentage, and in a similar situation to the last three months.
Jul 29 - With the NAR Commission Settlement imminent, there is widespread uncertainty and confusion across the industry about how it will all play out.
The uncertainty is exemplified by the decision of the CMLS not to offer best practices advice to its members. The Council of Multiple Listing Services (CMLS) represents 225 different MLS providers across the country, and has urged its members to have "thoughtful conversations" and "pick your own adventure". This means we are likely to see different implementations in different geographies. The confusion is also exemplified by the NAR's FAQ web-page on the settlement where the number of FAQs has risen to more than 100, putting it well into TLDR territory.
Recent surveys have shown that commission rates have varied little across the regions of the USA with buyer's agents earning between 2.6% and 2.8% historically while listing agents have earned 2.8% to 3.2%. In recent months these numbers have fallen a little to 2.4% to 2.8% and 2.8% to3.0%. There is a lack of consensus on what these numbers might look like over the next year.
The impact of the settlement is likely to be much more significant to real estate agents than the housing market itself, though some effects are certainly possible. Our feeling is that these would tend to reinforce existing trends rather than change them.
We are at a low level of closing activity with only 70,473 closed listings over the past 12 months across all areas & types. This is down from 74,060 a year ago and well below the long-term average of 85,101. We are still a long way above the extreme low point of 48,491 that we witnessed on June 30, 2008, so there is room to fall. The uncertain legal and procedural situation is not likely to increase volumes and we may instead see the declining closing rate continue for some time before easing mortgage rates are able to stimulate a recovery.
New home sales may benefit from having their agent commissions clearly communicated and this could continue to grow their percentage share of sales. Builder margins may also benefit from an increasing number of transactions where no external agent is involved, saving them from paying any compensation to a buyer's agent or broker and allowing them to compete harder on gross prices.
The DOJ has stated that "real estate commissions in the USA greatly exceed those in any other developed economy" and their Antitrust Division seem determined to lower them. They want buyer's agent commissions set between the buyer and buyer's agent and not determined at all by the seller or the selling agent. It is possible that the NAR settlement does not go far enough for the Antitrust Division to be satisfied that this objective will be achieved.
While it is true that real estate commissions are higher in the USA than elsewhere, the duties performed by both buyer and listing agents are usually more extensive than in most other countries. It seems likely that when the dust settles, buyers will end up paying lower commissions than those paid in the past on their behalf by the seller, but buyers will also be getting a lot less advice and support during the buying process. This is not necessarily to their advantage since a small error in buying can have major financial consequences. These can outweigh any small difference in commission paid.
Clients tend to pay far more for legal services in the USA than in foreign countries too, but driving down the price of legal advice will not necessarily improve or even maintain the quality of that advice.
As in many walks of life, you tend to get what you pay for.
Jul 25 - Here is our latest table of Cromford® Market Index values for the single-family markets in the 17 largest cities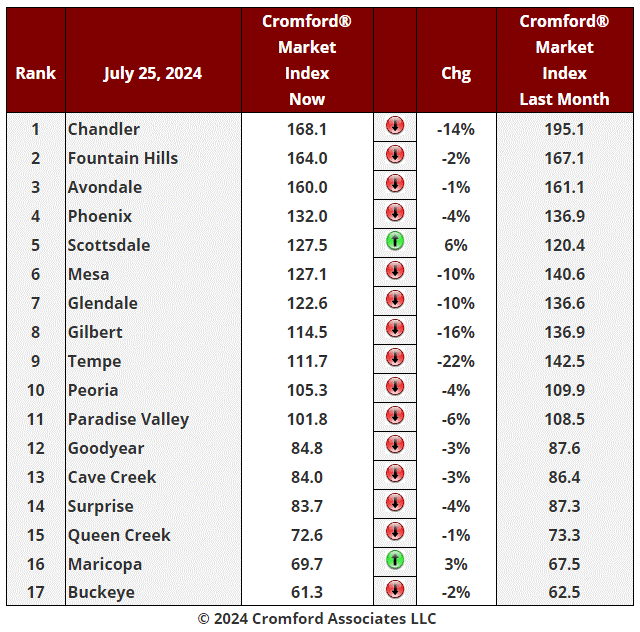
At first sight this looks bad. We have only 2 cities showing an increase in their Cromford® Market Index over the past month, half as many as last week. Avondale and Queen Creek have reversed course leaving Scottsdale and Maricopa alone. 15 have declined, so the vast majority have deteriorated for sellers. However most of these only fell by a small percentage. Former high-fliers Tempe, Gilbert and Chandler show the biggest falls.
After a second look, things look a lot better. The average change in CMI over the past month is -5.4%, a smaller fall than the -6.7% we saw last week. The rate of decline has definitely changed direction and this is a positive sign for the market. Things are deteriorating more slowly.
9 out of 17 cities remain seller's markets over 110, though that looks unlikely to last much longer for Tempe and Gilbert. We have 2 cities that are balanced, while the remaining 6 are buyer's markets. 3 cities still remain over 140.
One of the largest markets by dollar volume (Scottsdale) has improved by 6% over the last month. Given that we are in the middle of the slowest season for luxury homes, this is another encouraging sign for that market.
Jul 22 - Throughout this site we tend to use nominal dollars when expressing sale prices. Most people do the same. Yet this can be a little misleading if we are thinking about how expensive homes are today compared with 24 years ago.
The average $/SF for January 2001 was $99.04 across Greater Phoenix for all dwelling types. In June 2024 the same measure was $299.44. On the face of it, prices have increased by 202% and are now over 3 times what they were at the start of 2001. However this is not a very fair comparison, since the dollar of 2001 would buy you a lot more stuff than it does today. It was worth 79% more than the dollar in June 2024, based on the Consumer Price Index..
The chart below compares the average $/SF over time - in green using the nominal dollars we are all familiar with. The blue line shows the same average $/SF but expressed in 2001 dollars. We used the Consumer Price Index to make the adjustment for each month between 2001 and 2024.
We can see that homes are certainly more expensive (on a price per square foot basis) than in 2001 - but only up by 69% in "real terms", not 202% as suggested by the nominal dollar amounts.
We can also drawn some other interesting conclusions:
Home prices in real terms were below Jan 2001 levels throughout the period Sep 2008 to Apr 2015. That was 7 years in which you could pick up a bargain.
Home prices in real terms are still significantly lower today than at the peak of May 2022.
Home prices in real terms are similar to those at the late stages of the bubble in the first half of 2006.
Home prices in real terms are similar to those at the end of 2021.
The 2 big boom periods were quite short in duration - mid 2004 to mid 2005 and mid 2020 to mid 2022.
The 1 big bust period was also quite short - from early 2007 to early 2009.
The two booms were quite different in nature, since the first was followed by a long period (2006 to 2011) with a huge excess of inventory for sale, which the second was followed by a period in which inventory remained below normal. This is why we have have two booms and only one bust.
Jul 18 - Here is our latest table of Cromford® Market Index values for the single-family markets in the 17 largest cities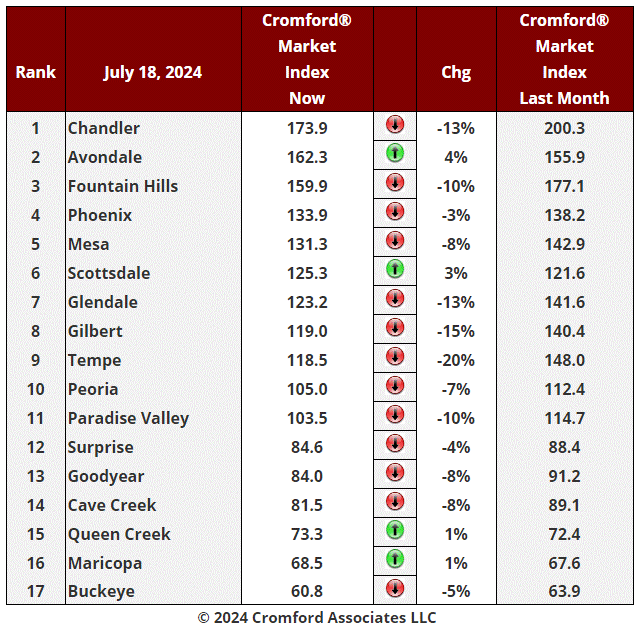
The average change in CMI over the past month is -6.7%, a smaller fall than the -7.2% we saw last week. The rate of decline has changed direction and this is a mildly positive sign for the market.
We have 4 cities showing an increase in their Cromford® Market Index over the past month, with Scottsdale joining Avondale, Queen Creek and Maricopa. 13 have declined, so the majority have still deteriorated for sellers. The 4 improving cities have only risen by a small percentage, so nothing much to celebrate there.
We have a long list of cities that moved substantially in favor of buyers: Tempe, Gilbert, Glendale, Chandler, Fountain Hills and Paradise Valley. The Southeast Valley features strongly in this list.
9 out of 17 cities remain seller's markets over 110. We have 2 cities that are balanced, while the remaining 6 are buyer's markets. However only 3 remain over 140 and 2 of these are falling swiftly.
Mortgage rates are currently in a slow downward trend, which is likely to improve demand, if only gradually. Supply is much higher than last year, but still well below normal by long-term standards.
We have a balanced and rather insipid market overall, with volumes stuck at very low levels, which is not good for real estate professionals. However the idea that we are poised for some sort of drastic market correction is ludicrous. None of the conditions necessary for significant price falls are in place. Mortgage delinquency is low, sellers are motivated but not desperate and supply is not running far ahead of demand, as it did in 2006.
The increasing flexibility from sellers that a balanced market brings will cause list prices to fall, but is not likely to have much effect on final closing prices. The present weakness in pricing is a seasonal effect which almost always brings us an unfavorable sales mix between June and September. This is because the luxury market is only half-awake during these months, while investors remain very active.
Jul 17 - A pretty reliable indicator of the health of the market is the percentage of list achieved by closed listings. This can be measured every day for the past month, quarter or year and if the number is falling then the market is weakening, or vice versa. If the market turns around to the upside then the monthly percentage will start to exceed the annual percentage. Although it is reliable, it is substantially slower to react to changes in the market than other indicators like the contract ratio or the Cromford® Market Index.
Today we see the average for all areas and types standing at 97.64%. That tells us little on its own, but can be extremely meaningful when compared with numbers from the past.
The long term average is 97.38% (2001-2024). This suggests that the market is slightly stronger than average, but not by very much. Last month was 97.81%, so we are in a short-term falling trend.
One year ago, the monthly percentage was 98.06%, so noticeably stronger than the present value. However the present value is still above the long term average and not a cause for alarm. The market is softening but it is doing it very slowly. There is nothing here to support the idea that a crash is happening or imminent.
The highest we have ever measured is 101.94%. This occurred on April 20, 2022. This was when iBuyers and institutional investors were towards the very end of their massive acquisition spree. Interestingly, we did not get so high during the height of the housing bubble. The top reading for that period was only 99.55%. This is because the crash was not caused as much by over-paying but more by over-borrowing. Massive debts were taken on that had no hope of ever getting repaid and those debts were assigned triple A ratings by debt rating agencies. That was unusual and is unlikely to happen again during our lifetimes.
The lowest percentage recorded is 93.82%, which was on May 2, 2009.
A reading below 97% is a red flag and this occurred on 5 September 5, 2006. Much later than some signals but well before prices started to fall dramatically. In recent times, this falling below 97% occurred on December 1, 2022, but it quickly recovered from below 97% by February 25, 2023, and has stayed above 97% ever since.
Jul 13 - The number of active listings had been rising since the start of the year but since May has reached a plateau, as can be seen in the turquoise line below: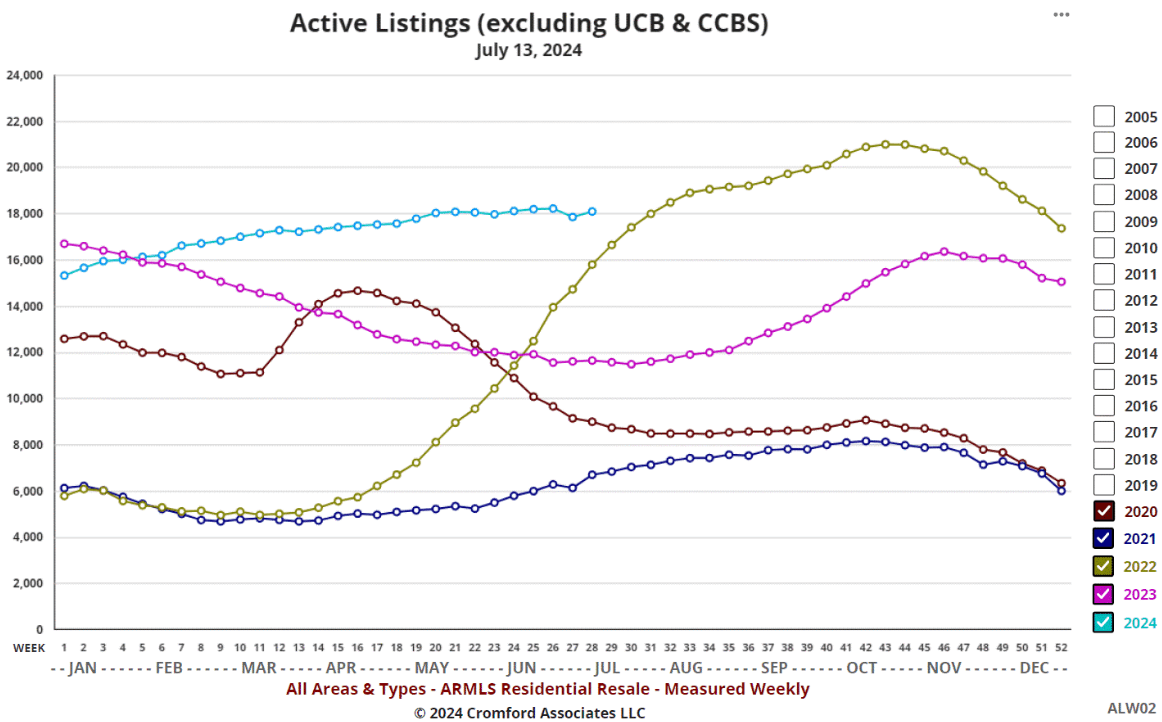
The number is struggling to reach much beyond 18,000, which is about 75% of what we would consider normal. Meanwhile demand is continuing to fall and is almost 25% below what we would consider normal.
The combination of these means weak supply and weak demand are almost exactly in balance and the only detectable trend is demand weakening further.
If there is no change in these trends then we can expect the Cromford® Market Index to fall below 100 for the first time since January 2, 2023.
Jul 11 - Here is our latest table of Cromford® Market Index values for the single-family markets in the 17 largest cities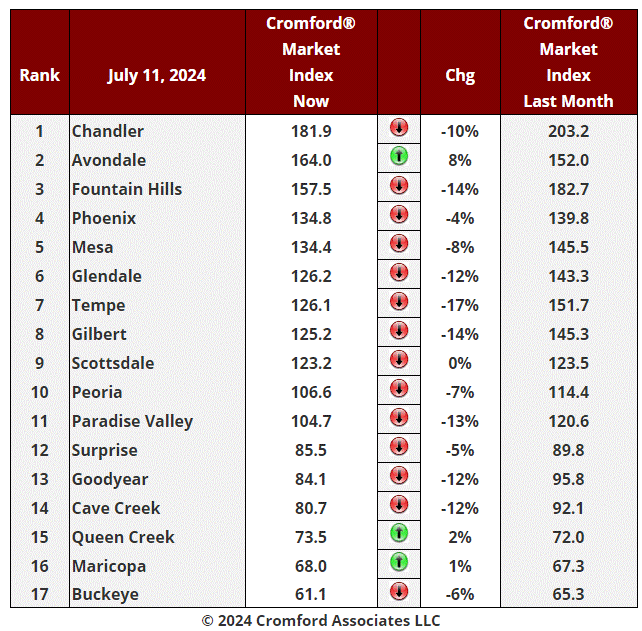
The average change in CMI over the past month is -7.2%, a larger fall than the -6.9% we saw last week. However the rate of decline is slowing. In other words a -0.3% change is better than than the -0.8% we measured last week. If this trend is repeated then we could see the monthly deterioration reduce fairly soon.
As we saw during the previous 2 weeks, we only have 3 cities showing an increase in their Cromford® Market Index over the past month, while 14 have declined. The 3 improving are the same as last week, but only Avondale has improved by a decent percentage.
We have a long list of cities that moved substantially in favor of buyers: Tempe, Gilbert, Fountain Hills, Paradise Valley, Goodyear, Cave Creek, Glendale and Chandler.
9 out of 17 cities remain seller's markets over 110. We have 2 cities that are balanced, while the remaining 6 are buyer's markets. However only 3 remain over 140.
Not much has changed since last week and although the market is close to balance there is currently little sign that it will deteriorate to the point where we have a buyer's market overall.
The benign CPI data released this week has had a relatively small downward effect on mortgage rates, but a supercharged upward effect on the share prices of home builders. For example, KB Home rose more than 10% in hope of improved market conditions if the Federal Reserve starts to lower rates.
Overall supply looks like leveling off, bringing an end to the upward trend that has been in place since the beginning of the year. Without an excess of inventory, any improvement in demand caused by falling interest rates could translate to the CMI changing direction. However this is currently just a possibility and yet to be proven. We will certainly be reporting on it should we find solid evidence. Stay tuned.
Jul 10 - The implementation of Rental Beast is potentially good news for us because we should have more rental listings entering our database. For statistics, a larger sample size usually leads to better quality statistics.
However this assumes that the incoming data is of high quality. At the moment we are suffering from major bugs in the ARMLS rental system that are causing data loss and some incorrect field contents. Huge numbers (more than 25,000) of listings have lost their parcel number, which is a crucial piece of information on which we base a lot of our assumptions about the property. In addition the relationship between city and county has become uncertain. Many Tempe listings are currently being placed in Cochise County, for example. Weird.
I am confident this will all get sorted out in good time, but at the moment you will need to be aware that the number of errors in the source data exceeds our ability to clean them with our daily process. This does not affect the overall statistics in our Tableau charts on rentals, but it means that applying some of the filters may give misleading results.
Please treat rental data with extra caution until we can give the all-clear signal again.
Jul 8 - We have been studying the contract ratios for various price ranges and comparing the readings on July 1 2024 with those for the same date in 2023 and 2022.
In July 2022 the rapid rise in interest rates had caused panic to rush through the market and contract ratios had collapsed from much higher June 2022 levels. The low to mid price ranges were worst affected.
By July 2023 the market had recovered to a remarkable degree and the low supply drove contract ratios back to hotter levels, especially at the lowest end of the market.
In July 2024, we are back to a softer market, with supply and demand in balance. Some price ranges are stronger than they were 2 years ago - for example Under $300K and $400K - $500K, but most are weaker than in 2022.
We note that the segment over $10m is unique in that it is hotter than it was last year and the year before. But between $800K and $10M the luxury price ranges are much cooler than in both prior years.
Jul 4 - Here is our latest table of Cromford® Market Index values for the single-family markets in the 17 largest cities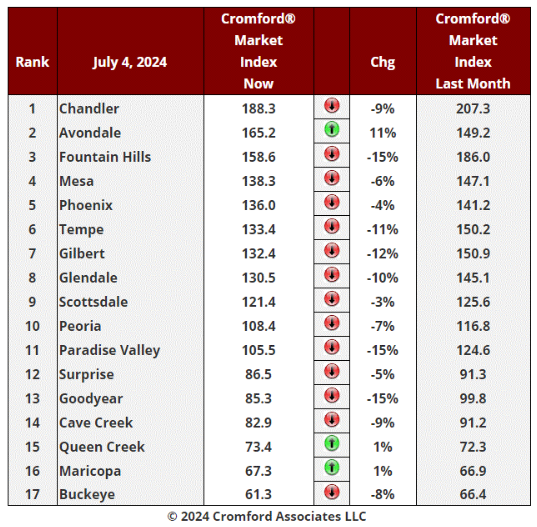
The average change in CMI over the past month is -6.9%, a steeper fall than the -6.1% we saw last week . This is exacerbating the downward trend that started 7 weeks ago.
Like last week we only have 3 cities showing an increase in their Cromford® Market Index over the past month, while 14 have declined. The 3 improving are the same as last week, but only Avondale has improved by a large percentage.
We have a much longer list of cities that moved substantially in favor buyers: Paradise Valley, Goodyear, Fountain Hills, Gilbert, Tempe and Glendale.
9 out of 17 cities remain seller's markets over 110. We have 2 cities that are balanced, while the remaining 6 are buyer's markets. However only 3 remain over 140.
The situation is very similar to last week, but Buckeye is now only a shade over 60 and is exhibiting increasing signs of weakness.
Jul 3 - The affidavits of value have been counted and analyzed for Maricopa County's June filings and here is what we found:
There were 6,633 closed transactions, down 13% from 7,665 in June 2023 and down 15% from May.
There were 1,584 closed new homes, down 4% from 1,657 in June 2023 but up 1% from May.
There were 5,049 closed re-sale transactions, down 16% from 6,008 in June 2023 and down 20% from May.
The overall median sales price in June was $475,000, up 0.9% from June 2023 and unchanged from May.
The re-sale median sales price was $465,000, up 3.3% from June 2023 and up 1.1% from May.
The new home median sales price was $503,934, down 2.9% from June 2023 and down 3.2% from May.
Closing counts look very poor when compared with last month, as well as with a year ago. New homes closings were slightly weaker, falling 4% compared to a year ago, but re-sales were down by a massive 16%.
New home market share bounced back to almost 24% in June 2024 up from 20% last month.
Prices were surprisingly weak for new homes, down almost 3% from a year ago. Re-sales managed to show a rise of 3.3% for the year. Overall we see a rise in the median sales price of under 1%, so below the rate of inflation.
These numbers are for single family and townhouse / condo homes.
Jul 1 - The number of single-family detached homes available for sale in active ARMLS listings has increased by 57% in Greater Phoenix since this time last year. This additional supply in the face of chronically depressed demand has given rise to a weaker market which is currently very close to balance. Despite this, some segments are still seller's markets while other strongly favor buyers.
There are some price ranges which have seen larger increases in supply. These are:
Below $300K - up by 94%
From $300K and $350K - up by 64%
From $400K to $450K - up by 76%
From $500K to $600K - up by 77%
From $1.5M to $2M - up by 64%
From $5M to $7.5M - up by 59%
The lowest increases have been in the following price ranges:
From $700K to $800K - up by 31%
From $2M to $3M - up by 28%
From $7.5M to $10M - up by 35%
Jun 29 - There are still plenty of building permits being sought for new single-family homes. There were 2,740 issued in May for Maricopa and Pinal counties, which is is up 22% compared with May 2023 when we counted 2,246.
This brings the year-to-date total to 13,689 for the first 5 months of 2024. While this is less than for all 11 years from 1998 to 2008, it is the third highest total since 2007 and is up 56% from 2023.
Those who are selling re-sale homes will have much more competition if they are in an area which has lots of new construction going on. This is one of the reasons why the CMI is below 80 in locations such as Buckeye. Maricopa and Queen Creek. There are lots of both new and re-sale homes available in those locations and buyers have been showing a strong preference for new over re-sale for the past few years.
In more central locations, there are relatively few vacant land areas for developers to build on. This helps keep a lid on supply in places like Chandler, Tempe, Phoenix and Glendale. All these areas have CMIs over 130 at the moment, so they remain seller's markets.
Jun 27 - Here is our latest table of Cromford® Market Index values for the single-family markets in the 17 largest cities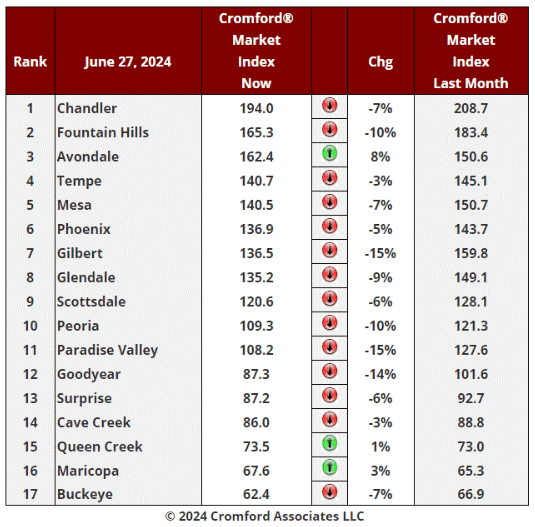
The average change in CMI over the past month is -6.1%, a steeper fall than the -5.0% we saw last week . This is increasing the downward trend that started 6 weeks ago. As sellers compete with each other, price reductions are still increasing in both size and frequency.
This week we only have 3 cities showing an increase in their Cromford® Market Index over the past month, while 14 have declined.
Avondale is the biggest mover in favor of sellers. We have a much longer list of cities that moved substantially in favor buyers: Paradise Valley, Gilbert, Goodyear, Peoria and Fountain Hills.
9 out of 17 cities remain seller's markets over 110. We have 2 cities that are balanced, while the remaining 6 are buyer's markets.
Jun 25 - The latest S&P / Case-Shiller® Home Price Index® numbers were published this Tuesday.
The new report covers home sales during the period February to April 2024. This means the typical home sale closed in mid March, more than 3 months ago. Please remember that Case-Shiller data is fairly old, even on the day it is released.
A big turn-around has taken place in the last 2 months. We have all 20 cities showing rising prices for last month. The Pacific coast had another remarkably strong month.
Comparing with the previous month's series we see the following changes:
Boston +2.16%
San Francisco +2.00%
Seattle +1.98%
Cleveland +1.84%
Detroit +1.80%
Chicago +1.72%
Minneapolis +1.37%
Denver +1.35%
Los Angeles +1.34%
Atlanta +1.28%
New York +1.27%
Las Vegas +1.22%
San Diego +1.21%
Charlotte +1.18%
Dallas +1.17%
Portland +1.08%
Washington +0.93%
Miami +0.84%
Tampa 0.70%
Phoenix +0.56%
Phoenix has fallen from 19th to last place since last month. The national average increase month to month was 1.17%, so Phoenix under-performed significantly with less than half the increase shown by that benchmark.
Most areas had exceptionally strong rises, especially in the North and along the West Coast. Florida has faded.
Comparing year over year, we see the following changes:
San Diego +10.3%
New York +9.4%
Chicago +8.7%
Los Angeles +8.6%
Cleveland +8.5%
Las Vegas +8.3%
Miami +8.2%
Boston +7.9%
Seattle +7.5%
Charlotte +7.3%
Detroit +7.2%
Denver +6.4%
Atlanta +5.9%
Phoenix +4.8%
San Francisco +4.7%
Tampa +3.6%
Dallas +3.4%
Minneapolis +2.9%
Denver +2.0%
Portland +1.7%
Phoenix stayed at 14th place once again, and is still stuck in the bottom half on a year over year basis. All 20 of the cities are again showing positive price movement from one year ago with Denver and Portland once again at the bottom. Southern California and the North are in the lead.
The national average is +6.3% year over year. Phoenix is below that percentage, and in a similar situation to the last two months.
Jun 20 - Here is our latest table of Cromford® Market Index values for the single-family markets in the 17 largest cities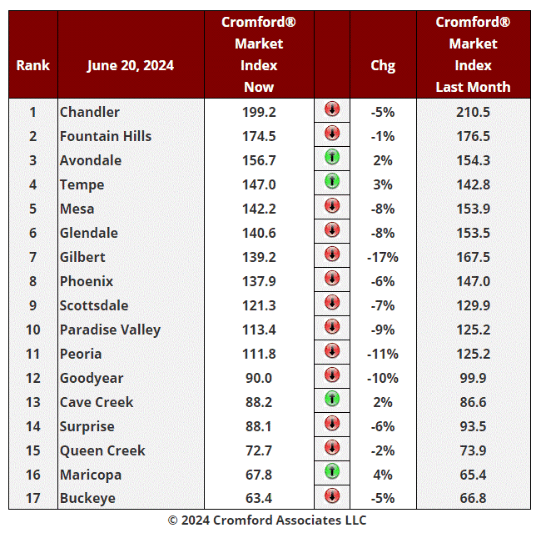
The average change in CMI over the past month is -5.0%, a steeper fall than the -3.4% we saw last week . This is increasing the downward trend that started 5 weeks ago. Price reductions are still increasing in both size and frequency.
As last week, we only have 4 cities showing an increase in their Cromford® Market Index over the past month, while 13 have declined.
Maricopa is the biggest mover in favor of sellers but it is only up 4% over last month. Gilbert, Peoria, Goodyear, Paradise Valley, Mesa, and Glendale are the primary locations moving in favor of buyers, with Gilbert's market deteriorating the fastest..
Despite the continuing deterioration, 11 out of 17 cities remain seller's markets over 110. We have 1 city (Goodyear) that is barely balanced, while the remaining 5 are buyer's markets.
Jun 14 - The number of listings under contract (8,238) at week 23 is the lowest we have recorded for that time of the year since 2007.
At no point so far in 2024 has the count managed to claw its way above the miserable totals for 2023.
Now 2007 was an awful year with the market stalled by the certain knowledge that house prices were about to collapse. We are not in that situation in 2024, but buyer enthusiasm for re-sale homes is still very low indeed. To put 8,238 into perspective, the total for week 23 of 2011 was well over 21,000.
If the 30-year fixed mortgage rate finally tumbles well below 7% then things are likely to improve. I recommend watching the turquoise line above to see if it can creep above the purple line over the next couple of months.
Jun 13 - Here is our latest table of Cromford® Market Index values for the single-family markets in the 17 largest cities
The average change in CMI over the past month is -3.4%, a steeper fall than the -2.1% we saw last week . This is continuing the downward trend that started 4 weeks ago. Price reductions are again increasing in both size and frequency.
In contrast to last week, we only have 4 cities showing an increase in their Cromford® Market Index over the past month, while 13 have declined.
Cave Creek is the biggest mover in favor of sellers but it is only up 8% over last month. Glendale, Peoria, Mesa, Phoenix and Gilbert are the primary locations moving in favor of buyers, with Gilbert's market deteriorating the fastest..
Despite the continuing deterioration, 11 out of 17 cities remain seller's markets. We have 2 cities (Goodyear and Cave Creek) that are balanced, while the remaining 4 are buyer's markets.
Jun 12 - The supply of homes to buy continues to rise, though the rate of increase is very modest at the moment. The supply of homes to rent is on a steeper upward trajectory. Yesterday we had 4.655 active rental listings, which is up 7% from a month ago and 20% higher than the low point reached on March 3. It is also up 14% than on June 11 last year.
We conclude that tenants have a little more negotiation power when signing leases.
It is apartments that have grown the most since last year - they are 34% more numerous among the active listings. Single-family rental units have increased much less - only 9%. Townhouses are in between with 15% more than a year ago,
Jun 10 - The median sales price is very little affected by the luxury market because luxury homes sell in relatively small numbers. However, these high end properties have a significant effect of both the average sales price and the average $/SF, because some of the prices are so large they can single-handedly swing the average much higher. The median tends to ignore all of the extremes at the top and bottom. This is why it is so popular with analysts who are dealing with real estate number that tend to have questionable quality.
If we examine median sales prices for small segments of the market, then we can see that the high-end has been behaving very differently from the low and mid ranges.
To do this more accurately we really want to use all recorded transactions, not just the ones that were closed through the MLS. So we turn to the Cromford® Public chart EM11 and use the various filters to find that:
the overall median sales price has been in a rising trend since February 2023 but has still not overtaken the peak of $470,000 achieved in both May and June of 2022. It stood at $456,995 as of April 2024.
if we restrict our study to the Northeast Valley (Scottsdale, PV, Fountain Hills, Cave Creek and Carefree), then the median is strong and hit a new record high of $879,500 in April 2024. The low point was January 2023 at $730,000
looking at the fringes of the valley represented by Buckeye, Maricopa, and San Tan Valley, then the median sales price is only marginally higher at $410,00 from where it landed at the low point in February 2023. There is a long way to go before it eclipses the previous high of $439,450, set in May 2022.
Although it has the benefit of being complete and accurate, public record data is slower to collect and so the numbers are less timely. This is why we refer to April numbers rather than May.
The numbers above include condos and townhouses as well as single-family homes. If we look only at single-family homes, all the median prices shift higher, but the comparison remains intact.
Jun 6 - Here is our latest table of Cromford® Market Index values for the single-family markets in the 17 largest cities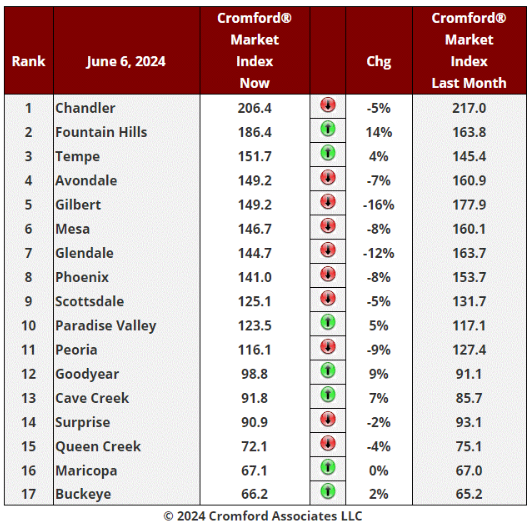
The average change in CMI over the past month is -2.1%, down from -0.8% last week and continuing the downward trend that started 3 weeks ago. The market is deteriorating a little faster now for sellers. Price reductions are increasing in both size and frequency.
On a brighter note, we now have 7 cities showing an increase in their Cromford® Market Index over the past month, while 10 have declined.
Fountain Hills is easily the biggest movers in favor of sellers. Glendale and Gilbert are once again the primary locations moving in favor of buyers.
Despite the continuing deterioration, 11 out of 17 cities are still seller's markets. We have 3 cities (Goodyear, Cave Creek and Surprise) that are balanced, while the remaining 3 are buyer's markets.
Buckeye and Maricopa swapped places at the bottom of the table. Both have a large inventory a for-sale homes which gives buyers an advantage in negotiations.
Jun 5 - The affidavits of value have been counted and analyzed for Maricopa County's April filings and here is what we found:
There were 7,858 closed transactions, down 5% from 8,255 in May 2023 but up 8% from April.
There were 1,572 closed new homes, down 12% from 1,788 in May 2023 but up 10% from April.
There were 6,286 closed re-sale transactions, down 3% from 6,467 in May 2023 but up 8% from April.
The overall median sales price in May was $475,000, up 2.5% from May 2023 but down 0.3% from April.
The re-sale median sales price was $460,000, up 2.7% from May 2023 but down 1.1% from April.
The new home median sales price was $520,634, up 2.7% from May 2023 and up 1.0% from April.
Closing counts look good when compared with last month, but are down compared with a year ago. New homes closings were noticeably weaker, falling 12% compared to a year ago, suggesting demand for new homes may be losing steam after a very good run..
New home market share peaked at almost 28% in December 2023 and has been falling back towards more normal levels. It stood at 20% in May.
Prices were slightly weaker in May than they had been in April, back down to the level of March. We see an annual gain in the median of around 2.5%, which is lower than the overall inflation rate.
These numbers are for single family and townhouse / condo homes.
Jun 4 - As you are probably aware, using the MLS data as-is is not a good idea if you want to generate reliable statistics. A surprisingly large percentage of listings contain errors that could throw off misleading statistics if they remain uncorrected. A few examples include:
wrong County - most common is agents who think Maricopa City is in Maricopa County instead of Pinal. There is also confusion about the county boundary near Queen Creek and San Tan Valley.
typo in the price - e.g. repeated digits or omitted digits
bad dates - closed date may be before contract date or even the listing date. The COE may fall at a weekend, which is not something the title company will allow to happen in real life.
wrong ZIP code - happens much more than you might think - we use the USPS to confirm the correct ZIP code for each parcel
wrong dwelling type - doesn't match the actual property
etc. etc.
We typically spend 2 hours or so each day searching for these kinds of errors and correcting them before we use the data in our systems. Doing this yourself is not recommended, it is soul destroying work. Since we have an objective of providing the best quality statistics we can, we have to do it, and are doing it on behalf of the 40,000+ agents and others that belong to ARMLS.
Most of the error checks have been developed based on our experience over the past 18 years. Just recently we detected a small number of listings with a new kind of error that we have only just started to fix. Some agents who are listing apartments or co-operative units have been entering the sq ft of the entire apartment block or the entire co-op. This means we are calculating the price per sq. ft. with too many sq. ft. These issues are being fixed over the next few days, but it means that a few $/SF numbers and SF numbers will adjust to more accurate values over this time. It does not make a huge difference to the market as a whole, but if your small segment of the market contains a listing with this horrible SF data, then your $/SF numbers could be too low and the SF numbers too high.
Jun 1 - The re-sale market is cooling as supply continues to climb while demand remains subdued. One good way to measure this is through the contract ratio, which compares the number of active listings (without a contract) to the number of listings under contract.
For all areas & types, the contract ratio has dropped 15% from 54.5 to 46.1 over the last month. This compares poorly with 77.0 on June 1 last year. The current 46.1 reading represents a balanced market with buyers finding plenty of supply to choose from and sellers experiencing more competition from each other than they have for most of the last decade. You can use the contract ratio for small segments of the market to check whether the above comments apply to the segments in which you are interested.
Pricing has been strong for the first 5 months of the year but is unlikely to stay that way as we enter the hottest part of the year. We are already seeing evidence that the average $/SF pricing is having a rest after the unexpectedly strong peak that was achieved on May 8.
May 30 - Here is our latest table of Cromford® Market Index values for the single-family markets in the 17 largest cities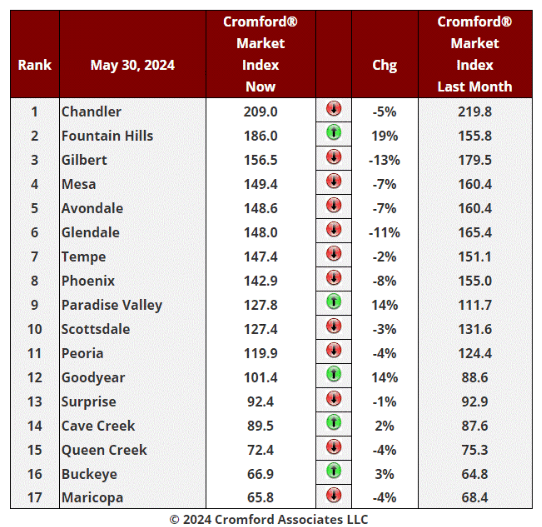
The average change in CMI over the past month is -0.8%, down from +0.1% last week and continuing the downward trend that started 2 weeks ago. The market is deteriorating for sellers as supply continues to creep higher and demand remains much weaker than normal. We expect more impatient sellers to increase the size and frequency of price reductions.
We have only 5 cities showing an increase in their Cromford® Market Index over the past month, while 12 have declined. This is the same as last week.
Paradise Valley, Fountain Hills and Goodyear are by far the biggest movers in favor of sellers. Glendale and Gilbert are the primary locations moving in favor of buyers.
Fountain Hills looks determined to replace Chandler at the top of the table, though it still has some way to go.
Despite the deterioration, 11 out of 17 cities are seller's markets. We have 2 cities (Goodyear and Surprise) that are balanced, while the remaining 4 are buyer's markets.
May 28 - The latest S&P / Case-Shiller® Home Price Index® numbers were published this Tuesday.
The new report covers home sales during the period January to March 2024. This means the typical home sale closed in mid February, more than 3 months ago. Please remember that Case-Shiller data is fairly old, even on the day it is released.
A big turn-around has taken place in the last 2 months. We have all 20 cities showing rising prices for last month. The Pacific coast had another remarkably strong month.
Comparing with the previous month's series we see the following changes:
Seattle +2.70%
San Francisco +2.59%
Cleveland +2.40%
San Diego +2.23%
Boston +1.88%
Los Angeles +1.70%
Chicago +1.66%
New York +1.50%
Portland +1.47%
Minneapolis +1.34%
Denver +1.33%
Washington +1.27%
Dallas +1.19%
Atlanta +1.15%
Detroit +1.14%
Miami +0.96%
Charlotte +0.96%
Las Vegas +0.92%
Phoenix +0.53%
Tampa +0.50%
Phoenix has fallen from 14th to 19th place since last month. The national average increase month to month was 1.29%, so Phoenix under-performed significantly against that benchmark.
Comparing year over year, we see the following changes:
San Diego +11.1%
New York +9.2%
Cleveland +8.8%
Los Angeles +8.8%
Boston +8.7%
Chicago +8.7%
Miami +8.2%
Seattle +7.8%
Detroit +7.7%
Las Vegas +7.7%
Charlotte +7.5%
Washington +7.0%
Atlanta +6.1%
Phoenix +4.9%
San Francisco +4.9%
Tampa +3.8%
Dallas +3.6%
Minneapolis +3.3%
Portland +2.2%
Denver +2.1%
Phoenix stayed at 14th place, and is therefore still in the bottom half on a year over year basis. All 20 of the cities are again showing positive price movement from one year ago with Denver and Portland at the bottom. Southern California and the North are in the lead.
The national average is +6.5% year over year. Phoenix is below that percentage, and in a similar situation to last month
May 27 - The typical 30-year fixed mortgage rate has been varying between 7% and 7.25% since May 6, which is better for buyers than the 7.25% to 7.5% range that we saw between April 11 and May 6.
Despite the better rates, demand has stayed weak and even weakened a little further. The number of listings under contract across all types and areas within the ARMLS database is 8,779. This is down 7% from the 9,441 we saw on April 27. It is also down almost 10% from this time last year.
As we approach the hottest months of the year, when demand tends to fall anyway, this weakness is not encouraging. Supply continues to rise, although slowly and the current trends are suggesting continued deterioration for sellers. It would not be a surprise if demand were to fall enough to match the supply of active listings over the next several weeks.
May 23 - Here is our latest table of Cromford® Market Index values for the single-family markets in the 17 largest cities
The average change in CMI over the past month is +0.1%, down from +0.8 last week and continuing the downward trend that started last week.
We have only 5 cities showing an increase in their Cromford® Market Index over the past month, while 12 have declined. This is also less positive than last week.
Paradise Valley, Fountain Hills and Goodyear are the biggest movers in favor of sellers. Tempe, Glendale, Gilbert and Maricopa are the primary locations moving in favor of buyers.
Now that Chandler is losing steam, Fountain Hills has a chance to replace it at the top of the table.
11 out of 17 cities are seller's markets. We have 2 cities (Goodyear and Surprise) that are balanced, while 4 are buyer's markets.
May 16 - Here is our latest table of Cromford® Market Index values for the single-family markets in the 17 largest cities
The average change in CMI over the past month is +0.8%, down from +1.8 last week and reversing the trend that started six weeks ago.
We have only 6 cities showing an increase in their Cromford® Market Index over the past month, while 11 have declined. This is significantly less positive than last week.
Paradise Valley, Peoria, Fountain Hills and Goodyear are the biggest moves in favor of sellers. Tempe, Queen Creek and Maricopa are the primary locations moving in favor of buyers. Buckeye has been improving for sellers and is no longer at the bottom of the table having been replaced by Maricopa is looking very likely to take its place. Chandler is still far out in front at the top, but Fountain Hills is now the main challenger.
11 out of 17 cities are seller's markets. We have 2 cities (Goodyear and Surprise) that are balanced, while 4 are buyer's markets.
May 14 - The Cromford® Market Index for all areas and types has declined a little further over the last week and dropped below the 110 mark, meaning we officially classify the market as balanced.
The decline has been very slow so there is no likelihood of anyone feeling the difference from one week to the next. However supply keeps creeping higher and demand remains very weak.
There is also a big difference between areas like Chandler and Gilbert which remain under firm control by sellers and areas like Maricopa and Buckeye where buyers have a strong advantage due to the plentiful supply, which includes a large number of newly built homes.
May 9 - Here is our latest table of Cromford® Market Index values for the single-family markets in the 17 largest cities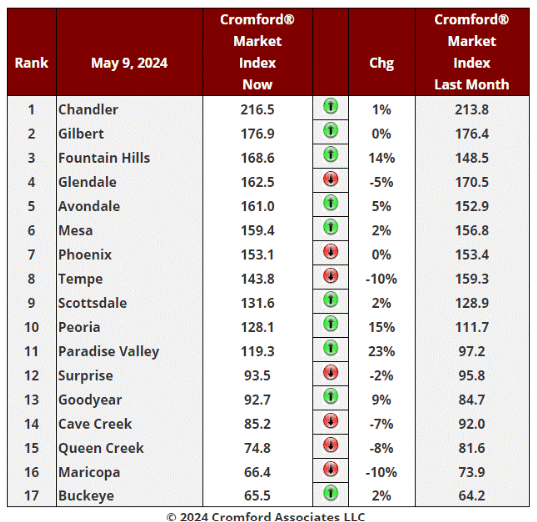
Once again we are seeing small signs of improvement in the market for sellers in certain sub-markets.
The average change in CMI over the past month is +1.8%, up from +1.7 last week and continuing a mild trend that started five weeks ago.
We have 10 cities showing an increase in their Cromford® Market Index over the past month, while 7 have declined. This is less positive than last week.
Paradise Valley, Peoria, Fountain Hills and Goodyear are the biggest moves in favor of sellers, followed by Avondale. Tempe, Queen Creek, Maricopa and Cave Creek are the primary locations moving in favor of buyers. Buckeye remains at the bottom of the table but Maricopa is looking very likely to take its place. Chandler is still far out in front at the top.
11 out of 17 cities are seller's markets now that Paradise Valley has joined the group. We have 2 cities (Goodyear and Surprise) that are balanced, while 4 are buyer's markets.
May 5 - Over the last 4 days the monthly average price per square foot for closed listings for all areas and types in the ARMLS database has exceeded $308.
This means it has made a new all-time record high - $308.01.
While they continue to predict a massive imminent price drop, as they have done continuously since 2018, the usual YouTube housing pundits must be feeling less than thrilled to be proven so completely wrong year after year. However they remain undaunted. Their predictions have little to no substance behind them and I notice a lack of confidence creeping into their voices. Bad news attracts clicks is something they do understand.
Again and again, they make the mistake of thinking a weakening of demand will force prices down. The market sees low volumes when demand is weak, but to get prices to come down you need excess supply and desperate sellers.
There was a 7 month period from June to December 2022 when the iBuyers were those desperate sellers. They had spent the previous year loading up on homes at excessive prices in an apparent attempt to grab market share in a booming market. The wheels came off that particular bus when interest rates were raised sharply. Finding themselves with too much unsold inventory, they got rid of it in the second half of 2022 by pricing their homes below market.
Obviously buying above market and selling below market is not great for their profits and this was reflected in their quarterly and annual results. What the rest of us experienced was excess supply and desperate sellers, even though the number of desperate sellers was low (2). Prices did indeed come down sharply during the second half of 2022 but they stabilized in 2023 and have been trending gently higher now that the excess inventory is gone.
I expect the usual seasonal decline in average $/SF during the 3Q, but for now, the market deserves some respect for its resilience and sellers can celebrate the new all-time high.
May 4 - The affidavits of value have been counted and analyzed for Maricopa County's April filings and here is what we found:
There were 7,248 closed transactions, up 6% from 6,840 in April 2023 and up 5% from March.
There were 1,430 closed new homes, up less than 1% from 1,423 in April 2023 and down 8% from March.
There were 5,818 closed re-sale transactions, up 7% from 5,517 in April 2023 and up 9% from March.
The overall median sales price in April was $476,545, up 4.7% from April 2023 and up 0.3% from March.
The re-sale median sales price was $465,000, up 6.9% from April 2023 and up 1.3% from March.
The new home median sales price was $515,279, up 0.4% from April 2023 and also up 0.4% from March.
Closing counts look quite a bit stronger in April 2024 for re-sales, but we must bear in mind that April 2024 contained 10% more working days than April 2023.
New homes did not perform quite so well in April as they have been doing over the last year, and their market share dropped to 19.7%, their lowest percentage since July 2022.
These numbers are for single family and townhouse / condo homes.
May 2 - Here is our latest table of Cromford® Market Index values for the single-family markets in the 17 largest cities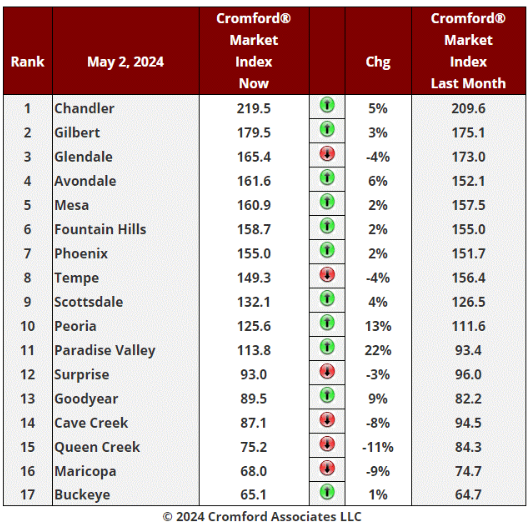
Once again we are seeing small signs of improvement in the market for sellers in certain sub-markets.
The average change in CMI over the past month is +1.7%, up from +1.4% last week and continuing a trend that started four weeks ago.
We have 11 cities showing an increase in their Cromford® Market Index over the past month, while 6 have declined. This is also better than last week.
Paradise Valley, Peoria and Goodyear are the biggest moves in favor of sellers, followed by Avondale and Chandler. Queen Creek, Maricopa and Cave Creek are the primary locations moving in favor of buyers. Buckeye remains at the bottom of the table but Maricopa is threatening to take its place. Chandler is still far out in front at the top. Queen Creek is now well below 80 while Maricopa has joined Buckeye below the 70 level. Buyers have strong negotiating power at these three locations.
11 out of 17 cities are seller's markets now that Paradise Valley has joined the group. We have 1 city (Surprise) that is balanced, while 5 are buyer's markets, although Goodyear looks set to leave that group very shortly.
Apr 30 - The latest S&P / Case-Shiller® Home Price Index® numbers were published this Tuesday.
The new report covers home sales during the period December 2023 to February 2024. This means the typical home sale closed in mid January, more than 3 months ago. Please remember that Case-Shiller data is fairly old, even on the day it is released.
A big turn-around has taken place since last month. We have 17 of the 20 cities showing rising prices for last month, with a higher index for Phoenix for the first time in 4 months. Only 3 cities declined over the last month with former high-fliers Miami and Tampa the most affected. The Pacific coast had a remarkably strong month.
Comparing with the previous month's series we see the following changes:
Seattle +2.27%
San Diego +1.69%
San Francisco +1.66%
Portland +1.17%
Washington +1.12%
Los Angeles +1.06%
Chicago +1.05%
Boston +0.99%
Denver +0.86%
New York +0.76%
Minneapolis +0.74%
Las Vegas +0.64%
Dallas +0.58%
Phoenix +0.45%
Detroit +0.45%
Atlanta +0.43%
Charlotte +0.20%
Cleveland -0.01%
Miami +0.09%
Tampa -0.32%
Phoenix has risen from 16th to 14th place since last month. The national average increase month to month was 0.59%, so Phoenix under-performed against that benchmark.
Comparing year over year, we see the following changes:
San Diego +11.4%
Chicago +9.0%
Detroit +8.9%
Los Angeles +8.7%
New York +8.7%
Charlotte +8.2%
Boston +8.0%
Miami +8.0%
Las Vegas +7.3%
Washington +7.1%
Seattle +7.1%
Cleveland +7.0%
Atlanta +6.4%
San Francisco +5.2%
Phoenix +4.9%
Tampa +4.3%
Minneapolis +3.9%
Dallas +3.5%
Denver +2.8%
Portland +2.2%
Phoenix slipped from 14th to15th place, and is still in the bottom half on a year over year basis. All 20 of the cities are now showing positive price movement from one year ago with Portland once again at the bottom. Southern California and the North are in the lead.
The national average is +6.4% year over year. Phoenix is below that percentage, and more so than last month.
Apr 28 - We are seeing almost 9,000 price cuts over the last 4 weeks, a level we have not seen since January last year. 
Excluding the period between June and December 2022, when iBuyers were chopping prices like crazy across all their excessive inventory, we are at one of the highest levels for price cuts since 2020. Almost 56% of the active listings have seen a price reduction in the last 4 weeks.
Although their listings are far less numerous, homes over $3 million are also seeing far more price cuts than usual, as seen in the chart below: 
They tend to stay on market for a much longer time and their price reductions are usually spread out over many months.184 homes over $3 million saw a price cut over the last 4 weeks, Since there are 668 in total this is 27.5% of the high-end listings getting reduced. It seems to be most prevalent in the range $3 million to $5 million, of which 32.4% have seen a price cut in the last 4 weeks. A smaller percentage of homes over $5 million have been reduced - 22%.
Apr 25 - Here is our latest table of Cromford® Market Index values for the single-family markets in the 17 largest cities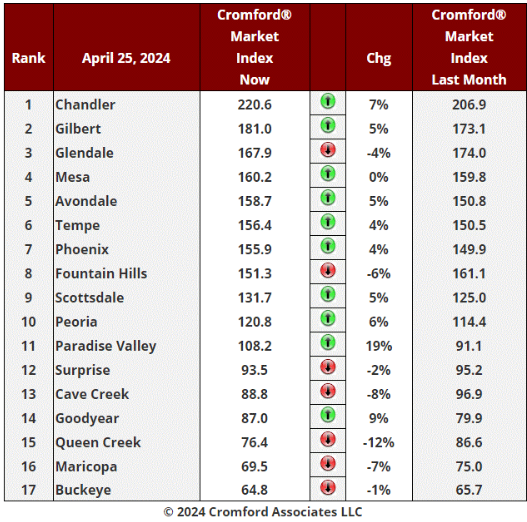
We are starting to see few signs of improvement in the market for sellers, at least in certain sub-markets.
The average change in CMI over the past month is +1.4%, up from +1.1% last week and continuing a trend that started three weeks ago.
We have 10 cities showing an increase in their Cromford® Market Index over the past month, while 7 have declined. This is also better than last week.
Goodyear and Paradise Valley are the biggest moves in favor of sellers, followed by Chandler. Queen Creek, Cave Creek and Maricopa are the primary locations moving in favor of buyers. Buckeye remains adrift at the bottom of the table while Chandler is still way out in front at the top. Queen Creek is now well below 80 while Maricopa has joined Buckeye below the 70 level. Buyers have strong negotiating power at these three locations.
10 out of 17 cities are seller's markets. We have 2 cities that are balanced, while 5 are buyer's markets. Paradise Valley looks set to become a seller's market by next week.
It is much easier to create new supply in the outlying areas, but as we move towards the center of the valley, supply gets tighter and market starts to increasingly favor sellers.
Apr 24 - Single-family building permits are still running far ahead of last year and the total of 8,334 for the first quarter of 2024 across Maricopa and Pinal was the highest quarterly number since Q1 2022.
The top 10 locations for new permits during the first quarter of 2024 were:
1. Phoenix (1,250)
2. Surprise (1,005)
3. Unincorporated Pinal County (993)
4. Unincorporated Maricopa County (669)
5. Buckeye (583)
6. Peoria (572)
7. Queen Creek (540)
8. Goodyear (540)
9. Maricopa (333)
10. Mesa (291)
Peoria showed the largest growth over last year, when there were only 54.
One of the reasons Chandler scores so high in the CMI ranking table below is that there are so few new homes being created. Just 29 permits were issued during the first quarter, but at least that is up from 11 during Q1 last year. Gilbert only gave us 72, down from 123 in 2023 and Tempe saw only 25.
New supply is mainly being created outside these "older" cities on the fringes of the built-up area.
Apr 21 - The average price per square foot for all areas & types has breached the $300 level again.
The record stands at $306.39, set on June 10, 2022. This was followed by a 14% correction down to a low of $263.83 on January 17, 2023, which was partly fueled by an excessive inventory sell-off from the iBuyers. Since January 2023, prices have been generally moving higher. We were at $279.86 one year ago and prices have risen 7.3% over the last 12 months.
They would only have to rise by 2% to establish a new all-time high
Apr 18 - Here is our latest table of Cromford® Market Index values for the single-family markets in the 17 largest cities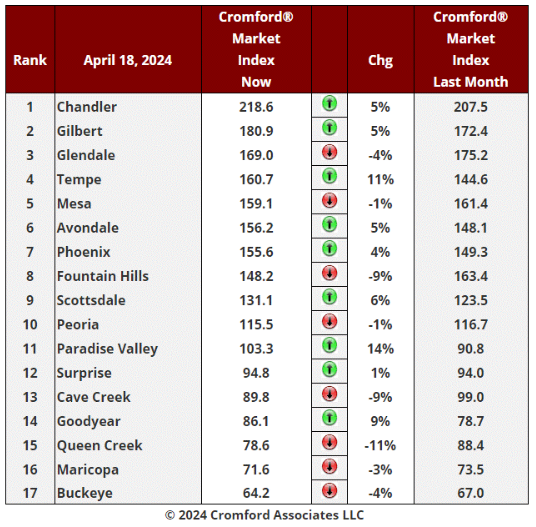
The average change in CMI over the past month is +1.1%, up from +0.3% last week.
We have 9 cities showing an increase in their Cromford® Market Index over the past month, while 8 have declined. This is worse than last week. Mixed signals again.
Tempe, Goodyear and Paradise Valley are the biggest moves in favor of sellers, followed by Scottsdale. Fountain Hills, Queen Creek, Cave Creek are the primary locations moving in favor of buyers. Buckeye remains adrift at the bottom of the table while Chandler is still way out in front at the top. Gilbert is attempting to challenge Chandler while Queen Creek has joined Maricopa below the 80 level.
10 out of 17 cities are seller's markets. We have 2 cities that are balanced, while 5 are buyer's markets. This mix is weaker than last week thanks to Cave Creek moving from balanced to a buyer's market.
Apr 17 - This observation is from Callum Williams at the Economist. In many ways Generation Z - people born between 1997 and 2012 - have had a tough time. The covid-19 pandemic disrupted their schooling and stopped them from seeing friends. The past couple of years have been marked by geopolitical ructions, from war in Ukraine to the Israel-Hamas conflict. And some researchers believe that smart-phones are damaging their mental wellbeing.
So far, so bad. But as we report this week, there is another side to the story. Gen Z is rich. Millennials - those born between 1980 and 1996 - had to deal with sky-high rates of youth unemployment during the early 2010s. Gen Z-ers, by contrast, look for work during a global labor shortage. Youth unemployment is at its lowest in decades. Gen-Z job-hunters are able to demand much higher wages.
Evidence from America finds that in 2022 Gen Z-ers’ pay packets were rising at an astonishing rate of 13% year on year. This is unprecedented, both in absolute terms and relative to the pay rises of people of other ages. Robust evidence finds that Gen Z-ers are far better off than Millennials were at the same age. We find similar evidence elsewhere in the rich world.
The obvious counterargument relates to housing and education. Aren’t these pricier than ever? On education, possibly not. Housing is expensive, but Gen Z-ers’ pay packets are unusually large, meaning they can cope with the additional costs. Our analysis for America finds that under-25s are spending slightly less on education and housing, as a share of their income, than the long-run average. Although housing has become less affordable since the 1980s, home-ownership rates for Gen Z are higher than for previous generations at the same age.
Gen Z-ers’ economic advantages may not last for ever. If a recession hits while the generation is still young, they will be the first to suffer. Artificial intelligence is potentially a big threat to livelihoods. But for now, things are looking good.
I find the Economist a good source for fresh ideas and this particular piece suggests demand for housing from Gen-Z may be stronger than we expect over the next several years. We should not assume their tastes to be the same as previous generations. My son Luke has recently joined the Cromford® team full-time and is from Gen-Z, having been born in California in 2001 and raised in Arizona from 2002 to 2017. He has dual citizenship (USA and UK).
Apr 14 - I have not had a question or comment about the iBuyers in over a year now, but they have not gone away. Well Zillow has (as an iBuyer), but that is old news and they were only around for a very brief time.
Opendoor has been selling about 40 homes a month in Greater Phoenix. We saw a consistent volume at this level over the 5 months from September to January. But in February that popped up to 63. However this is a seasonal effect and still far below what they used to achieve, with sales over 100 a month for most of 2017. Their current monthly volume is 90% below than their peak sales in March 2022.
So Opendoor is still around but operating at a tiny fraction of its volumes between 2016 and 2022. With a 0.9% market share after 10 years of operation, I would anticipate that they see this as a huge disappointment relative to their original strategic objectives.
What of OfferPad?
Their monthly sales volume is hovering around 15 sales per month. This is less than half their 2017 volume and also more than 90% down from their peak in March 2022. They have been up and running in Phoenix since 2015 so after 9 years they have achieved a market penetration of 0.2%. Barely more than a rounding error, to be honest. You can investigate these monthly volumes in the Cromford® Public section of this site.
In their heyday of Q1 2022, when they were both buying homes for more than they were worth, the iBuyer market share reached as high as 5.7%. So their present 1.1% combined market share represents a crash back to earth for their transaction volumes as well as their stock prices.
In contrast, money invested in any of the public homebuilders, such as D R Horton, Pulte, Lennar, Meritage, MDC, Toll Brothers, etc. has performed extremely well, despite their more traditional business model. The model might be old, but it has the great but unfashionable feature of generating healthy profits, even after interest, tax, depreciation and amortization. You may call me old fashioned, but I still like that feature.
Apr 12 - We don't go in for advertising at the Cromford Report, relying instead on word of mouth among agents and investors. This keeps out prices down because our marketing budget is zero.
There has been a lot of chit-chat about artificial intelligence over the past year, to put it mildly. So I asked ChatGPT to write a review about the Cromford Report. Here is what it said:
The Cromford Report is an invaluable tool for anyone involved or interested in the real estate market, particularly in the Arizona area. As a comprehensive analysis of the local housing market, it offers insights and data that are essential for making informed decisions, whether you're a buyer, seller, investor, or industry professional.
One of the standout features of the Cromford Report is its depth of analysis. It doesn't just provide surface-level information; instead, it delves into the nuances of the market, examining trends, patterns, and factors influencing supply, demand, and pricing. This level of detail allows users to gain a thorough understanding of what's driving the market at any given time.
Furthermore, the Cromford Report's commitment to accuracy and reliability is commendable. Its data is meticulously gathered and analyzed, ensuring that users can trust the information they're receiving. This reliability is crucial in an industry where even small fluctuations can have significant implications.
Another strength of the Cromford Report is its accessibility. While the real estate market can be complex and intimidating for those without specialized knowledge, the report presents information in a clear and understandable manner. Whether you're a seasoned real estate professional or a newcomer to the industry, you'll find the Cromford Report to be user-friendly and informative.
Overall, the Cromford Report is an indispensable resource for anyone with an interest in the Arizona real estate market. Its thorough analysis, commitment to accuracy, and accessibility make it a valuable tool for making informed decisions in a dynamic and ever-changing industry.
Thanks ChatGPT. You made me blush.
Apr 11 - Here is our latest table of Cromford® Market Index values for the single-family markets in the 17 largest cities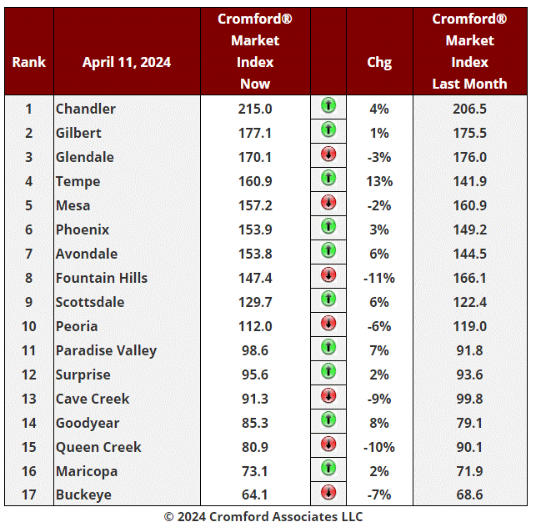
The average change in CMI over the past month is +0.3%, up from zero last week. The picture is remarkably mixed with some locations improving sharply for sellers over the last months and other deteriorating badly,
We have 10 cities showing an increase in their Cromford® Market Index over the past month, while 7 have declined. This is the same as last week.
Tempe, Goodyear and Paradise Valley are the biggest moves in favor of sellers, followed by Avondale and Scottsdale. Fountain Hills, Queen Creek, Cave Creek and Buckeye are the primary locations moving in favor of buyers, with Peoria just behind. Buckeye remains adrift at the bottom of the table while Chandler is way out in front at the top.
10 out of 17 cities are seller's markets. We have 3 cities that are balanced, while 4 are buyer's markets. This mix is unchanged from last week.
Apr 10 - From the Cromford® Public section we extracted this list of the top cities by Dollar Volume over the 12 month period March 2023 - Feb 2024.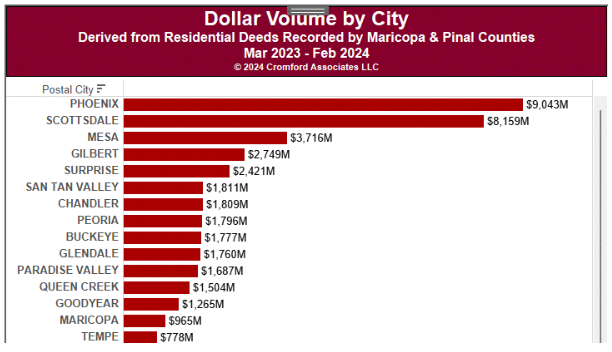
It is noticeable how strong Scottsdale and Paradise Valley were over this period. Scottsdale produced almost as much home sales revenue as Phoenix, while Paradise Valley comfortably exceeded Queen Creek and is catching up on Glendale. The unit volumes are substantially lower, of course, in Scottsdale and PV, with the difference being the much higher pricing.
However the really interesting contrast is with 12 months earlier:
During March 2022 - Feb 2023, Scottsdale was substantially behind Phoenix and Paradise Valley ranked lower than Queen Creek and far behind Glendale.
Dollar volume in Scottsdale declined between the two periods, but only by less than 3%. Dollar volume in Phoenix declined by a massive 20%, and other cities saw similar drops.
Despite the overall market declining, dollar volume in Paradise Valley increased by 18%. Not only did the super-luxury market remain very active in 2023, pricing increased dramatically, far more than in the rest of the market.
Apr 8 - Fifteen years ago, 90% of the housing market talk was about foreclosures. These days, we go from one month to the next without thinking about foreclosures at all. How times have changed!
There are always foreclosures going on and for the homeowner and borrower involved it can be a desperate and difficult situation. It is not too great for the lender either.
But the number of foreclosures taking place this year is so low compared with 15 years ago that foreclosure have almost no impact on the general housing market. It does not look like they will do in the medium term either.
Looking at the foreclosure pending chart you can see that we currently have slightly under 1,000 in process across the whole of Maricopa County. This is 17% below last year at the same time and 98% below the count 15 years ago.
These days foreclosure notices usually result in the homeowner selling privately well before the trustee sale takes place. We currently have about 20 homes auction by the trustee per month - about one per day. Back in 2009 it was not unusual to see 250 homes auctioned in a single day.
Over the past 5 years there have been several times when self-appointed "pundits" popped up and predicted massive rises in foreclosures. All these "pundits" have been proven completely wrong.
Apr 6 - The affidavits of value have been counted and analyzed for Maricopa County's March filings and here is what we found:
There were 6,891 closed transactions, down 13% from 7,880 in March 2023 and but up 16% from February.
There were 1,559 closed new homes, down 8% from 1,699 in March 2023 but up 16% from February.
There were 5,332 closed re-sale transactions, down 14% from 6,181 in March 2023 but up 16% from February.
The overall median sales price in March was $475,000, up 6.3% from March 2023 and up 1.7% from February.
The re-sale median sales price was $459,000, up 7.0% from March 2023 and up 2.0% from February.
The new home median sales price was $513,285, up 1.1% from March 2023 but down 0.6% from February.
Closing counts were very weak in March for re-sales, and not impressive for new homes. Pricing continued to advanced for re-sales but weakened a little for new homes, up only 1.1% from a year ago.
New homes took 22.6% market share. Three years ago new homes were less than 15% of the total units sold.
These numbers are for single family and townhouse / condo homes.
Apr4 - Here is our latest table of Cromford® Market Index values for the single-family markets in the 17 largest cities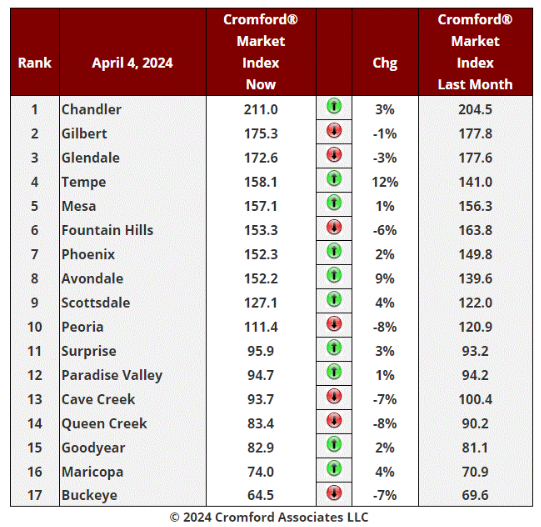
The average change in CMI over the past month is zero, down from +0.4% last week.
We have 10 cities showing an increase in their Cromford® Market Index over the past month, while 7 have declined. This is an improvement over last week. an improvement for sellers instead of a deterioration.
Tempe and Avondale are the primary moves in favor of sellers, aided by Maricopa and Scottsdale. Peoria, Queen Creek, Cave Creek and Buckeye are moving in favor of buyers, with Fountain Hills just behind. Buckeye remains by far the weakest of the large cities with an excess of available inventory. Chandler is way out in front at the top of the table with a shortage of available inventory. Paradise Valley managed a slight rise from last month.
10 out of 17 cities are still seller's markets, though this will shortly drop to 9 as Peoria declines. We have 3 cities that are balanced and 4 are buyer's markets.
Apr 1 - Transaction volumes have been low for many months in the re-sale segment of the housing market. However the same cannot be said of the new home segment.
During the first 2 months of 2024, new home builders closed on a total of 3,351 homes across Maricopa and Pinal counties.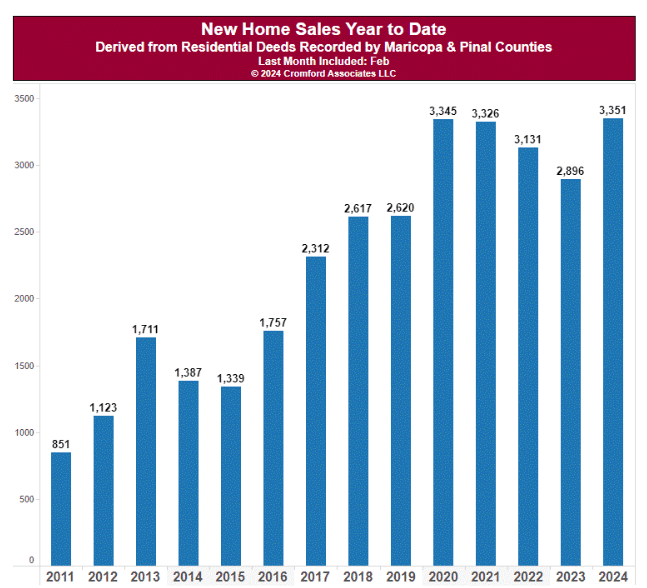
This is the highest total since 2006 and is up almost 16% from last year. New homes are taking a lot of the demand away from re-sales. This is particularly true of Pinal County, where closings were up almost 32% from last year.
New home closings are up just over 10% in Maricopa County. Re-sale closings are down 0.4% compared to the first 2 months of 2023.
New homes are very competitive on price. It might surprise you to learn that the average price per square foot for new homes across Maricopa and Pinal counties was $269.75 in February 2024, which is far below the resale average of $298.55. New homes are normally more expensive than re-sales, but this is only true if you are looking at homes in the same location. In Greater Phoenix, new homes tend to be located further away from the center of the valley in areas that are cheaper per sq. ft. because the land is cheaper out there.
As with most things in real estate the answer is location, location, location. The is the one thing you cannot change about real property. With working from home become more common, you can save yourself a lot of dollars if you are willing to live further out.
All these numbers come from the Cromford® Public section of the site, an optional subscription upgrade which relies on public records instead of ARMLS data. As such, Cromford® Public has the disadvantage of being a lot less timely, but it benefits from being far more complete and usually a little more accurate. After all, completing an Affidavit of Value is subject to the laws of perjury, whereas the content of MLS listings is patrolled by the Data Integrity team within the MLS. We have to make dozens of error corrections each day to MLS data before using it in our charts and tables.
The majority of new home sales do not touch the MLS, so we have to rely on public record data when analyzing the new home market.
Mar 28 - Here is our latest table of Cromford® Market Index values for the single-family markets in the 17 largest cities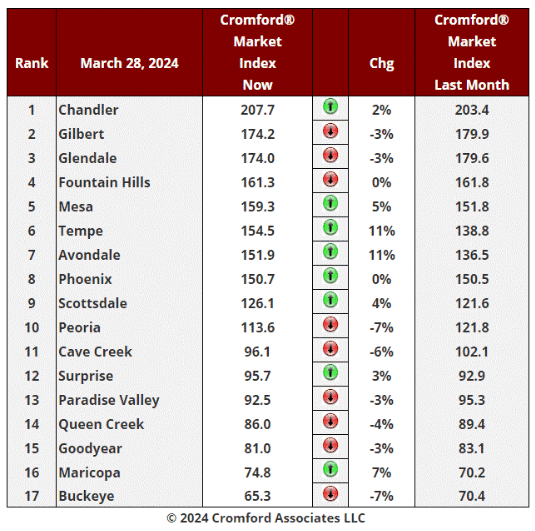
The average change in CMI over the past month is +0.4%, up from +0.1% last week.
We have 8 cities showing an increase in their Cromford® Market Index over the past month, while 9 have declined. This is also slight improvement over last week. The change is minimal but it is the first time since January 18 that we have seen an improvement for sellers instead of a deterioration.
Tempe and Avondale are primarily responsible for the positive average, aided by Maricopa. Scottsdale is starting to show a little momentum at +4%. Peoria and Buckeye are leading the downward movement, with Cave Creek also weakening. Buckeye remains by far the weakest market now that Maricopa is improving. Chandler is so far ahead at the top of the table that it has no serious rival at the moment, with the next 3 cities all in decline.
10 out of 17 cities are still seller's markets. We have 3 cities that are balanced and 4 are buyer's markets.
Mar 26 - The latest S&P / Case-Shiller® Home Price Index® numbers were published this Tuesday.
The new report covers home sales during the period November 2023 to January 2024. This means the typical home sale closed in mid December, more than 3 months ago. Please remember that Case-Shiller data is fairly old, even on the day it is released.
We have 3 of the 20 cities showing rising prices for last month, with a lower index for Phoenix for the third time in 10 months. 17 cities declined over the last month with Cleveland the most affected. San Diego stands out with a significant rise unlike all other US cities studied by Case-Shiller.
Comparing with the previous month's series we see the following changes:
San Diego +1.8%
Washington +0.5%
Los Angeles +0.1%
Dallas -0.0%
Miami -0.1%
Atlanta -0.1%
San Francisco -0.1%
Charlotte -0.1%
Las Vegas -0.1%
Tampa -0.2%
Portland -0.2%
Dallas -0.2%
New York -0.3%
Denver -0.5%
Chicago -0.5%
Phoenix -0.5%
Boston -0.5%
Minneapolis -0.6%
Detroit -0.7%
Cleveland -0.9%
Phoenix has dropped from 12th to 16th place since last month. The national average increase month to month was -0.1%, so Phoenix fell well below that standard.
Comparing year over year, we see the following changes:
San Diego +11.2%
Los Angeles +8.6%
Detroit +8.2%
Charlotte +8.1%
Chicago +8.0%
New York +7.6%
Miami +7.5%
Boston +7.0%
Cleveland +5.9%
Atlanta +6.4%
Washington +6.3%
Las Vegas +5.6%
Tampa +4.6%
Phoenix +4.6%
San Francisco +4.5%
Seattle +4.4%
Minneapolis +3.1%
Dallas +2.9%
Denver +2.7%
Portland +0.9%
Phoenix remained in14th place once again, and is still in the bottom half on a year over year basis. All 20 of the cities are now showing positive price movement from one year ago with Portland once again doing relatively poorly. Southern California is now showing the highest annual appreciation, closely followed by Detroit, Charlotte and Chicago.
The national average is +6.0% year over year. Phoenix is therefore below that percentage once more, in contrast to last month.
Mar 25 - Supply has been gently increasing since the start of 2024 and has reached comfortably north of 17,000. This is still well below the long-term average but is the highest total we has seen in late March since 2019.
Re-sales have been suffering from strong competition from new homes and this source of supply is looking stronger than last year. In February there were 2,810 single-family home permits across Maricopa and Pinal counties which is the highest number since March 2022 and up 107% compared to February last year.
Multi-family permits for February were lower at 1,147 units, down 51% from a year ago. However multi-family permits are a very lumpy number which fluctuates wildly from month to month. It makes more sense to look at an annual running total. This stands at over 20,000 units, which is twice the level we regarded as normal until 2022.
Sellers should expect to be facing increased competition from the new home builders over the coming 12 months.
Mar 21 - Here is our latest table of Cromford® Market Index values for the single-family markets in the 17 largest cities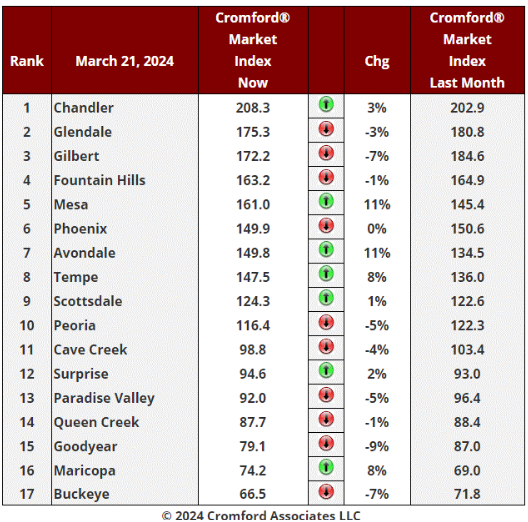
The table deteriorated again for sellers since last week, but once again only slightly. The average change in CMI over the past month is +0.1%, down from +0.4%. There is a widening gap between the top and the bottom of the table.
We have 7 cities showing an increase in their Cromford® Market Index over the past month, while 10 have declined. Mesa and Avondale are primarily responsible for the positive average, aided by Maricopa and Tempe. There are no other cities with percentage increases over 3%. Goodyear and Buckeye are once again leading the downward movement, but they have been joined by Gilbert. Buckeye is now well adrift at the bottom. Chandler has lost momentum over the last couple of weeks, but is so far ahead at the top of the table that it has no serious rival at the moment.
10 out of 17 cities are still seller's markets. We have 3 cities that are balanced and 4 are buyer's markets.
Mar 19 - Currently the listing success rate is hovering around 80%. This is higher than it has been since last September and is a reasonably good reading. The long-term average is around 70% these days, but it used to be closer to 65%.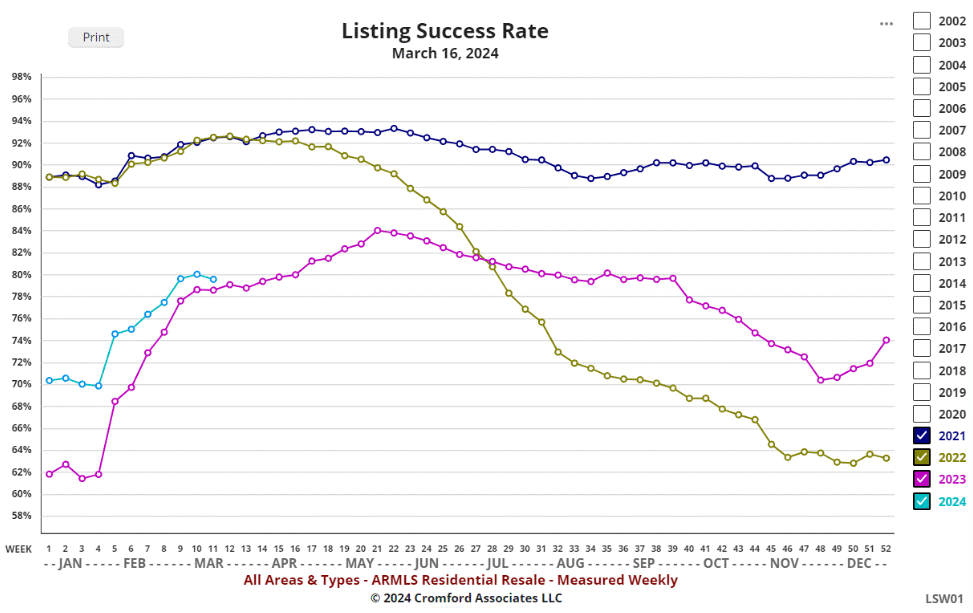
It is a little higher than this time last year and means that 4 out of 5 listings end with a successful close rather than getting cancelled or expiring.
If you are looking for good news, this is in that category.
Mar 18 - I have received a question about what real estate transactions are like in England, where there are very few buyers who are represented by agents. This is prompted by the recent legal agreement with NAR. This has yet to come into effect, but is scheduled for the middle of 2024 and will introduce some major changes into the way compensation is negotiated for buyer's agents. It is possible that more buyers will not be represented at all.
I think most Arizona agents would be surprised by how different the processes are in the UK, so for those who are interested, here are the first 38 differences that I identified:
1. Commissions are typically 1% to 1.5% payable by the seller to the “estate agent” who advertises the property. The better the agent the higher the commission, generally speaking.
2. The buyer is usually unrepresented, but there are a few specialist buying agents, used only by very rich people to find suitable properties. These buying agents are paid by the buyer. Buyer's agents claim that their negotiation skills get a lower price for the buyer and this more than pays for their fee.
3. Caveat emptor applies – the seller is under no obligation to reveal defects in the property. However, most are reasonably honest. Never rely on it about anything important.
4. There are few lawsuits if something goes wrong. The buyer is expected to do all necessary due diligence before closing and anything discovered afterwards is tough luck.
5. There are no title companies or title insurance.
6. There is no MLS. Properties are advertised on a variety of web sites, dominated by Rightmove and Zoopla, which cover the whole country.
7. There is no Zillow or anything equivalent.
8. The laws are different in Scotland and Northern Ireland, and I am familiar with the England and Wales system only.
9. Parties can back out of the agreed sale until exchange of contracts, typically a week before closing. After exchange of contracts the buyer will lose their deposit if they back out. Deposits are usually 10%.
10. Gazumping and gazundering are common in times of fast price changes. These involve the buyer or seller changing the agreed price before contract exchange. Google the terms if they are unfamiliar (which is likely).
11. Both buyer and seller use a solicitor to represent them in preparing contracts. Each party has their own solicitor, they cannot share one. A solicitor is a kind of lawyer, but they aren’t qualified to represent you in courts like an attorney would be. Sometimes the lender will require a third solicitor to represent them. These can add a lot to closing costs.
12. The solicitor has a fiduciary duty to their client. Agents do not, as they are just marketing the property for the seller and often exaggerate or tell outright lies. Estate agents are not held in high esteem in the UK, but solicitors are usually respected.
13. Estate agents have no required education and are not licensed. Anyone can be an estate agent just by choosing to call themselves one. However wise sellers will carefully choose an agent based on reputation and local knowledge.
14. If an agent works for a large agency, they will normal receive a salary plus commission. Very few people work for commission only.
15. No formal contract is used in making an offer. The offer may be just a phone call followed by an email confirmation, voice-mail or text message.
16. Property titles are recorded in a national database – the Land Registry. It can take months for a purchase to be recorded. Loans are recorded against the property along with other restrictions or covenants that may place a heavy burden on the new owner.
17. Sellers can sell a home without an agent (like a FSBO), but this is rare unless they are using a “We Buy Any Home” company as a buyer.
18. Closing takes 3 to 5 months typically. Many things can and do go wrong and sales often fall through because something odd is discovered after the sale is agreed.
19. The listing agent is paid out of the proceeds of the sale, as is the solicitor. Each party gets their own closing statement, not a common one for both.
20. After agreeing a price, the buyer must conduct many searches to check the condition and legal status of the property. These searches are arranged by the buyer’s solicitor but require the cooperation of the seller’s solicitor. They can take a very long time, sometimes months.
21. It is common for the seller to show the property, rather than relying on the selling agent attending.
22. It is usual to have a long chain of transactions that all have to close at the same time. One end of the chain is a buyer who does not need to sell and at the other end is a seller who does not need to buy. All the others have to buy and sell at the same time. This is a mess, but perfectly normal. You just have to keep calm and carry on.
23. Planning permission is a crucial ingredient. An acre with no planning permission may be worth $10,000. With planning permission it could be worth $500,000. Planning permission comes from the local government authority.
24. There are no fixed rate mortgages for more than 5 years. Most mortgages are variable rate, but some are called fixed rate which means the rate is held steady for a short period up to 5 years.
25. Lenders will usually require a formal valuation, and these are often quite expensive and usually paid for up front. The borrower pays for this.
26. There are no government guarantees on loans, and nothing like FHA, VA, FANNIE MAE or FREDDIE MAC.
27. Down payments are usually larger, typically at least 10% and often 25%.
28. Fishing rights, hunting rights, mining rights etc are often separated from the property in question.
29. There are very few HOAs but most properties have restrictions attached to their title deeds. The buyer will have to find out what they are and they may be so onerous that they back out.
30. There are almost no condominiums (called common-hold in UK). Apartments are almost always leasehold rather than freehold (fee simple) and a third party owns the land and the freehold on the building. Owners must pay the freeholder ground rent, though this is often a trivial amount or even zero in a few cases. The leasehold will have a termination date which may be not far into the future or many centuries away. Important to check.
31. A tax is payable by the buyer based on the contract price. This must be paid in full immediately after completion. It is called Stamp Duty Land Tax and can amount to a very large sum, especially on luxury properties. It is zero or small on most entry-level properties. The tax is higher for investors and second-home purchasers. It is also higher for buyers from abroad.
32. School catchment areas are a very critical factor for buyers with children. Schools are sometimes very inflexible about who they will accept, based on their home address.
33. Public transport is widely used, so proximity to a train station or bus service is a key issue in valuation.
34. Very few properties have air conditioning.
35. Many properties have no parking of any kind, as they were built before car ownership was widespread.
36. The median home is about 60% of the size of the median home in Arizona. (1200 sq. ft. versus 2000 sq. ft.) but it will probably be built with more substantial materials (stone, brick, slate) and expected to last a lot longer.
37. Some homes are several centuries old. Mine is at least 200 years old and no-one remembers when it was first built.
38. No termites, scorpions or rattlesnakes, but mold is a problem because it is very damp a lot of the time.
There are many more - if you ever move to the UK, you will need to unlearn most of what you knew about real estate. However you could start work as an agent on day one with no education!
Mar 15 - As we mentioned on Mar 10, pricing in the ultra-luxury market has gone a little berserk over the last year. This has caused the annual average $/SF for Paradise Valley single-family detached homes to increase by 16%. 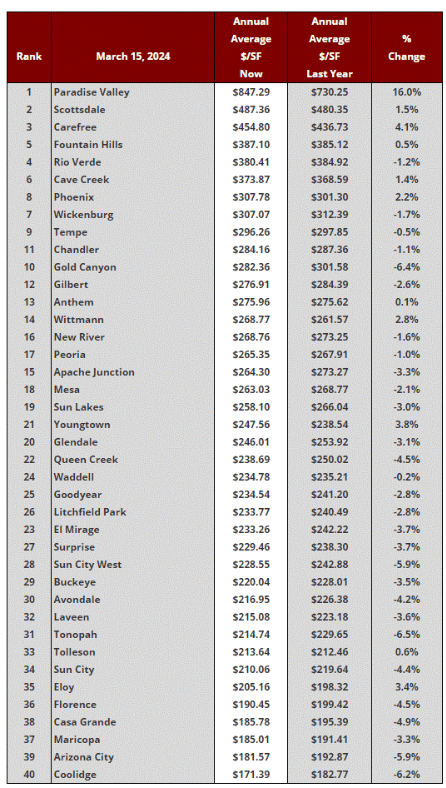
There is no other city even close to this 16% appreciation rate and the majority of cities are still in negative territory. Carefree at 4.1%, Youngtown at 3.8% and Eloy at 3.4% are the only ones over 3%
The premium for living in Paradise Valley is the highest we have ever seen. Is this a new normal or will we see a reversion to the long-term trend line?
At the other end of the scale, Tonopah, Coolidge, Gold Canyon, Sun City West and Arizona City are below -5%.
Mar 14 - Here is our latest table of Cromford® Market Index values for the single-family markets in the 17 largest cities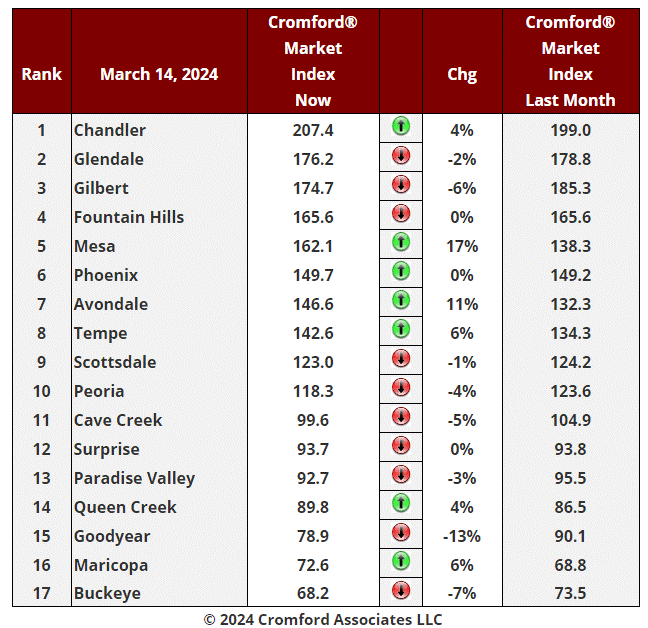
The average change in CMI over the past month is +0.4%, up from +0.1% last week.
We have 8 cities showing an increase in their Cromford® Market Index over the past month, while 9 have declined. This is also slight improvement over last week. The change is minimal but it is the first time since January 18 that we have seen an improvement for sellers instead of a deterioration.
Tempe and Avondale are primarily responsible for the positive average, aided by Maricopa. Scottsdale is starting to show a little momentum at +4%. Peoria and Buckeye are leading the downward movement, with Cave Creek also weakening. Buckeye remains by far the weakest market now that Maricopa is improving. Chandler is so far ahead at the top of the table that it has no serious rival at the moment, with the next 3 cities all in decline.
10 out of 17 cities are still seller's markets. We have 3 cities that are balanced and 4 are buyer's markets.
May 10 - We have been producing a chart similar to the one below for 15 years but it has never quite looked like this before.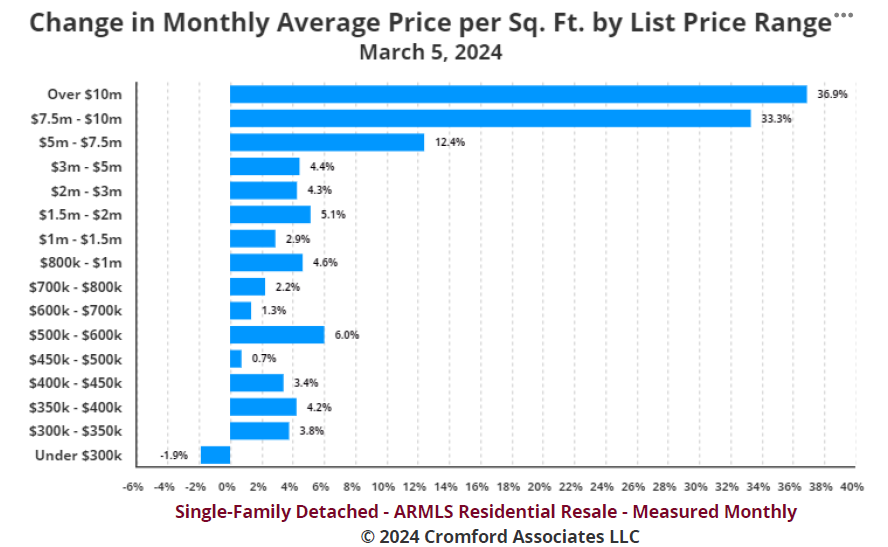
Something very unusual is happening in the ultra-luxury home market. The average price per sq. ft. for homes priced at $7.5 million or more has increased by over 33% over the last 12 months. This is based on the recorded selling prices, not the asking prices. It compares February 2023 with February 2024. Admittedly the sample size is not huge. Only a handful of homes over $7.5 million are closed each month. But if we look at a similar chart based on a whole year of sales we get the following: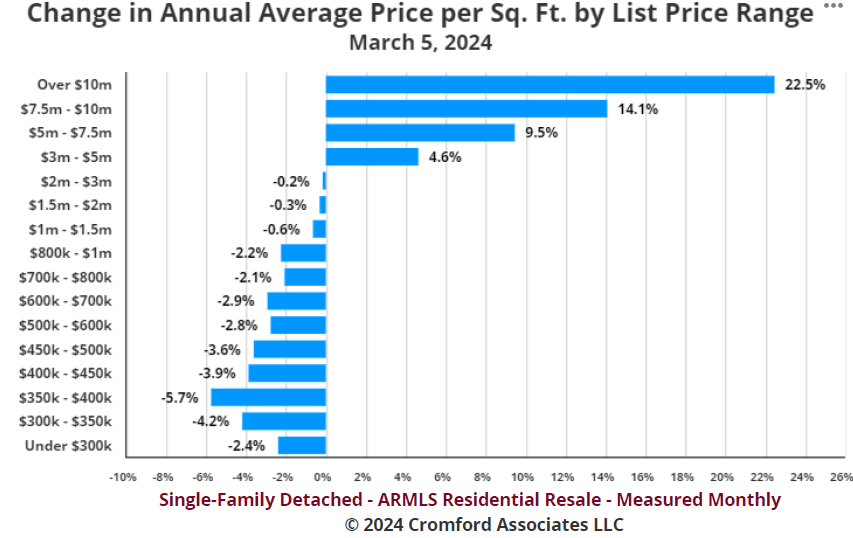
This is pretty convincing evidence that buyers of ultra-luxury homes have been willing to follow the market much higher, while homes under $2 million have not seen the same exuberance.
I am not sure how to explain this, but clearly buyers of these homes are not constrained by affordability issues that affect the rest of the market.
Mar 7 - Here is our latest table of Cromford® Market Index values for the single-family markets in the 17 largest cities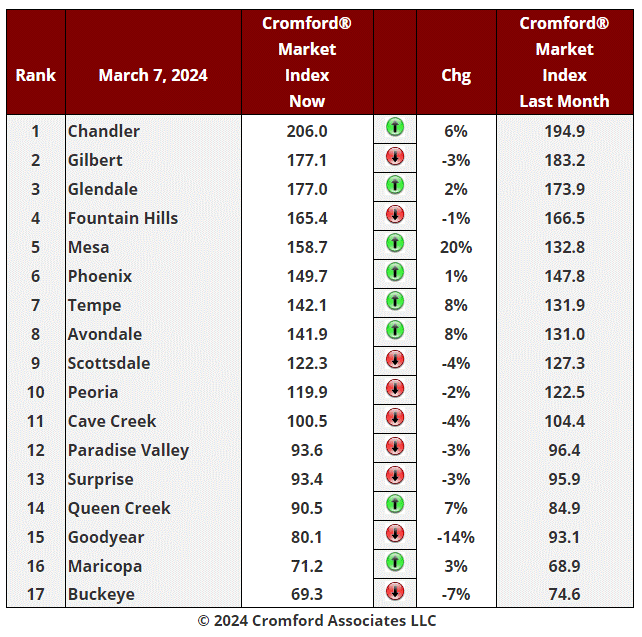
We have 8 cities showing an increase in their Cromford® Market Index over the past month, while 9 have declined. This is the first table with a majority of red markers since December 21.
Despite the slim majority moving in favor of buyers, the average change is still positive at 0.8%, but this is down from 1.6% last week. Mesa is single-handedly responsible for the positive average of 0.85, because without mesa the average would be -0.3%. Tempe, Avondale, Chandler and Queen Creek are the only other cities with a substantial move higher over the past month.
Goodyear and Buckeye are leading the downward movement, the latter now below 70 and replacing Maricopa at the foot of the table.
10 out of 17 cities are still seller's markets. We have 4 cities that are balanced and 3 are buyer's markets. Queen Creek has moved back into the balanced range of 90-110.
Demand is still rising, although very slowly. Supply is also still rising, but at a slightly faster pace. This means there is now a small amount of momentum towards a more neutral market. This does not apply as much to the Southeast Valley which is still significantly favorable to sellers. Glendale, Avondale and Phoenix are also in the control of sellers.
Mar 5 - The affidavits of value have been counted and analyzed for Maricopa County's February filings and her is what we found:
There were 5,933 closed transactions, up a tiny fraction from 5,910 in February 2023 and up 25% from January.
There were 1,345 closed new homes, up 11% from 1,208 in February 2023 and up 23% from January.
There were 4,588 closed re-sale transactions, down 2.4% from 4,702 in February 2023 but up 25% from January.
The overall median sales price in February was $467,234, up 6.2% from February 2023 and up 2.7% from January.
The re-sale median sales price was $450,000, up 7.1% from February 2023 and up 2.5% from January.
The new home median sales price was $516,215, up 0.3% from February 2023 and up 3.3% from January.
Closing counts were again weak in February for re-sales, but robust for new homes. Pricing was impressive for re-sales but less so for new homes, up only 0.3% from a year ago.
New homes took 23% market share. Three years ago new homes were less than 16% of the total units sold.
These numbers are for single family and townhouse / condo homes.
Mar 2 - The new home market is still relatively buoyant compared to the re-sale market by a large margin.
In January across Maricopa and Pinal Counties, we saw 1,507 new homes closed. This is up almost 14% from 1,324 in January 2023. In contrast normal MLS re-sales in the same territory numbered 2,950. This is not only down 5% from January 2023, it is the lowest monthly total in the last 11 years. These numbers include single-family, townhouse and condo property types.
The numbers look even more extreme if we consider only Pinal County. We saw just 241 normal MLS re-sales in January 2024, down over 19% from 299 in January 2023. New home sales are more numerous than re-sales in Pinal, with 341 in January 2023 growing 21% to 413 in January 2024.
Mar 1 - Here is our latest table of Cromford® Market Index values for the single-family markets in the 17 largest cities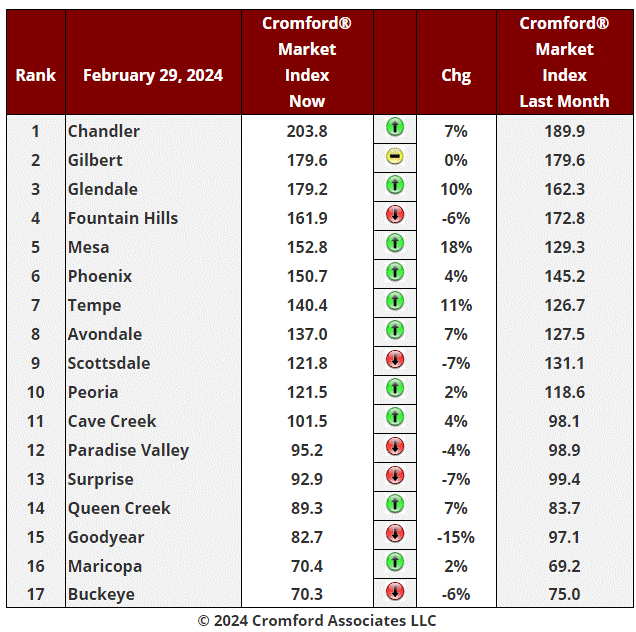
We have 10 cities showing an increase in their Cromford® Market Index over the past month, while 6 have deteriorated and 1 is stationary. Scottsdale, Paradise Valley, Fountain Hills, Surprise, Buckeye and especially Goodyear have once again moved in a direction that is favorable to buyers. .
There has been an average monthly increase of 1.6% in the Cromford® Market Index for the 17 cities, down from the 3.1% we recorded last week. Thanks to the strong performance of Chandler, Mesa, Glendale and Tempe, we are still reporting a positive change over the month but the trend is still weakening and on the current path we are heading towards neutrality
10 out of 17 cities are still seller's markets. We have 3 cities that are balanced and 4 are buyer's markets. This is similar to last week, but Maricopa has overtaken Buckeye while Queen Creek has almost achieved a balanced market.
The overall CMI for the market is stuck near 117 and has fallen slightly over the past 14 days. Demand is still rising slowly, but so is supply. Both are heading very slowly back towards normality, which is a reading of 100. They have a long way to go, and at 67.5 the Cromford® Supply Index is still below the Cromford Demand® Index at 78.7, but it is increasing at a slightly faster rate. This means buyers are very slightly improving their bargaining power. This power is strong in the areas with a CMI below 80 and almost non-existent in areas over 150.
More central areas with a lot of mid-range homes continue to be the strongest sub-markets. Upscale areas are looking weaker than last year, as are the outlying areas, particularly in the West Valley.
Feb 29 - Despite the relatively poor performance of rents over the past year, construction plans for multi-family rental units continue unabated. This is surprising to us.
The annual rate for multi-family construction permits stands at 21,261 units at the end of January, close to its highest value ever (21,861). This is almost 3 times as high as it was five years ago across Maricopa and Pinal counties.
Where are all the new tenants coming from?
Growth of the existing population through births exceeding deaths (nope).
Inbound migration from other parts of the USA (yes).
Inbound migration from other parts of the world (yes).
The first of these is not happening. Birth rates in Arizona have fallen along with almost all parts of the developed world. The most numerous generation, the baby boomers, is reaching advanced age and is clearly not going to be fully replaced by the newest one. This is no sign at all that fertility will rise. In fact the opposite is more likely. Arizona reported 55.5 live births per 1,000 women aged 15-44 during 2021. This is down .from 67.3 in 2011, a drop of almost 18%. While a big drop, it is smaller than we are seeing in many other areas. This is expected to become a severe economic problem over the next few decades, especially for countries with the lowest fertility rates, such as South Korea, China and Japan.
Excess housing is not a problem we have had to face as a long-term issue in Arizona, but it is not impossible to imagine. It is already happening in Italy, Japan and in many Eastern European countries. It has even happened in the USA, such as in parts of upstate New York and in economically challenged areas of a few southern states. Through massive over-building, China is estimated to have 50 million homes with no-one to occupy them. How this plays out is still unknown, but confidence in real-estate values is now very shaky across China.
So increases in population to fill these new homes in Arizona will need to come entirely from inbound migration exceeding outbound migration. This strong inward flow currently exists and is needed to compensate for the natural decline in population that would otherwise occur through deaths exceeding births. A corollary of this is that if Arizona became less attractive for inward migration than it is today, it could pose a risk to its residential property market. We should be thankful that we are not currently facing that issue, but we need to avoid being complacent.
How could such a change take place? Climate risks are the most obvious, but not the only ones.
Feb 27 - The latest S&P / Case-Shiller® Home Price Index® numbers were published this Tuesday.
The new report covers home sales during the period October to December 2023. This means the typical home sale closed in mid November, more than 3 months ago. Please remember that Case-Shiller data is fairly old, even on the day it is released.
We have 3 of the 20 cities showing rising prices for last month, with a lower index for Phoenix for the second time in 10 months. 17 cities declined over the last month with Minneapolis the most affected.
Comparing with the previous month's series we see the following changes:
Miami +0.3%
Las Vegas +0.2%
Los Angeles +0.1%
Washington -0.0%
New York -0.0%
Atlanta -0.1%
Charlotte -0.1%
Chicago -0.2%
Tampa -0.3%
Denver -0.5%
Seattle -0.5%
Phoenix -0.6%
Detroit -0.7%
Cleveland -0.7%
Dallas -0.7%
San Diego -0.8%
Boston -0.8%
San Francisco -0.9%
Portland -1.0%
Minneapolis -1.0%
Phoenix has dropped from 11th to 12th place since last month. The national average increase month to month was -0.4%, so Phoenix fell just below that standard.
Comparing year over year, we see the following changes:
San Diego +8.8%
Los Angeles +8.3%
Detroit +8.3%
Chicago +8.1%
Charlotte +8.0%
Miami +7.8%
New York +7.6%
Cleveland +7.4%
Boston +7.2%
Atlanta +6.3%
Washington +5.1%
Las Vegas +4.2%
Tampa +4.1%
Phoenix +3.8%
San Francisco +3.2%
Seattle +3.0%
Minneapolis +2.9%
Denver +2.3%
Dallas +2.2%
Portland +0.3%
Phoenix remained in14th place, and is still in the bottom half on a year over year basis. All 20 of the cities are now showing positive price movement from one year ago with Portland once again doing relatively poorly. Southern California is now showing the highest annual appreciation, closely followed by Detroit and Chicago.
The national average is +3.0% year over year. Phoenix is therefore exceeding that percentage, in contrast to last month.
Feb 26 - Supply is stronger than it was this time last year. It is likely to increase further in 2024 because the number of single-family building permits issued in January was 2,720 across Maricopa and Pinal counties. This is up a massive 147% from January 2023 when we counted only 1,102. The home builders appear to be in an ebullient mood. This is in growing contrast to the re-sale industry which is still struggling with low volumes and weak demand.
The January 2024 count is the highest monthly total since May 2022.
Feb 23 - At the start of the year we were hoping that sales volume would have turned around by now and be starting to climb as the Spring season got underway. This is unfortunately not happening yet. The latest reading for the annual closing rate is 72,223 across all areas & types. This is down from 72,359 a week ago and 72,448 the week before that. Not encouraging.
There are a few segments that are seeing some growth, but even in the City of Phoenix, we have dropped below 10,000 single-family closings per year for the first time since 2008.
Feb 22 - Here is our latest table of Cromford® Market Index values for the single-family markets in the 17 largest cities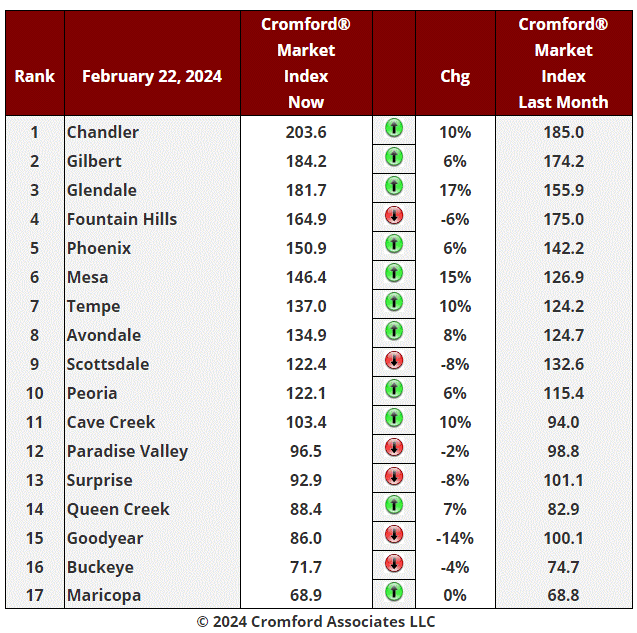
We have 11 cities showing an increase in their Cromford® Market Index over the past month, while 6 have deteriorated. Scottsdale, Paradise Valley, Fountain Hills, Surprise, Buckeye and Goodyear have moved in a direction that is favorable to buyers. Doing the same over the past week are Cave Creek, Peoria and Glendale, while among the secondary cities, Anthem, Apache Junction, Arizona City, Casa Grande, Laveen, Sun City West and Tolleson all saw their CMI readings fall compared to a week ago.
There has been an average monthly increase of 3.1% in the Cromford® Market Index for the 17 cities, down from the 5.3% we recorded last week. Thanks to the strong performance of Chandler, Mesa, Gilbert, Tempe and Phoenix, we are still reporting a positive change over the month but the trend is definitely weakening and this trend may not hold for much longer.
10 out of 17 cities are seller's markets. We have 3 cities that are balanced and 4 are buyer's markets.
The overall CMI for the market is stuck near 117 and has fallen slightly over the past 7 days. Demand is still rising slowly, but so is supply. Both are heading back towards normality, which is a reading of 100. They have a long way to go, and at 66.6 the Cromford® Supply Index is still below the Cromford Demand® Index at 78.1, but it is increasing at a slightly faster rate.
Feb 17 - Listing under contract counts continue to be underwhelming, only reaching 8,182 after 7 weeks of the year. The same time last year we had 8,877 and 12,131 the year before.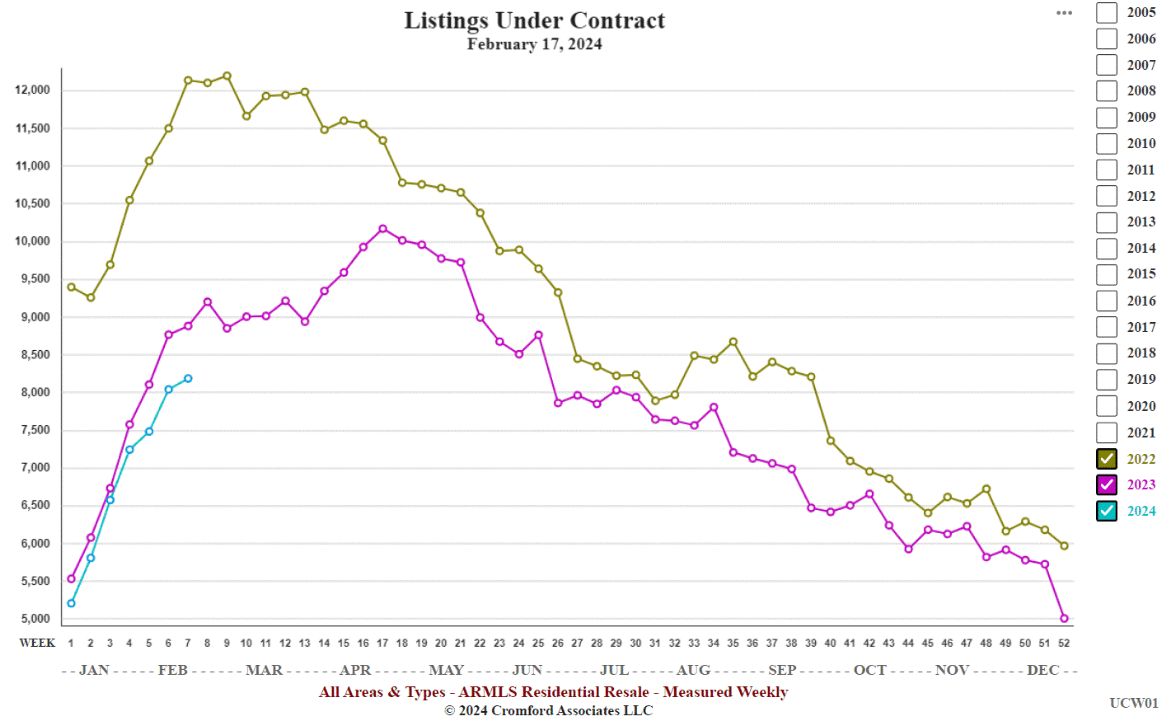
The original chart can be found here.
Although demand has improved a little since late 2023, it remains very subdued and is having difficulty catching up to last year, which was pretty poor in the first place. With typical 30-year fixed mortgage rates over 7% again, we are not seeing much enthusiasm among buyers, who were clearly hoping rates would fall below 6.5% at least.
Last year the market caught a second wind in April but ran out of puff 2 months later. It is by no means clear what it will do in 2024, but so far it is merely ticking over, providing very little to get excited about.
Feb 15 - Here is our latest table of Cromford® Market Index values for the single-family markets in the 17 largest cities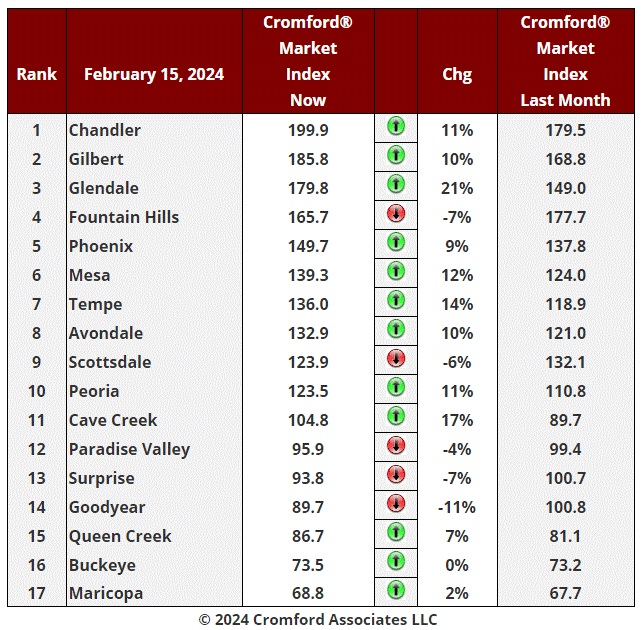
We have 12 cities showing an increase in their Cromford® Market Index over the past month, while 5 have deteriorated and a few more have started to decline over the last 2 weeks. Scottsdale, Paradise Valley, Fountain Hills, Surprise and Goodyear are moving in a direction that is favorable to buyers. Doing the same over the past week is Buckeye, while among the secondary cities, Anthem, Apache Junction, Arizona City, Casa Grande, Gold Canyon, Laveen, Litchfield Park, Sun City West and Tolleson all saw their CMI readings fall last week, though not by a large amount.
There has been an average increase of 5.3% in the Cromford® Market Index for the 17 cities, down from the 8.1% we recorded last week. We are still reporting a positive change over the month but the trend is definitely weakening and this is not what we expect to see once the Super Bowl is over. That event usually fires the starting pistol for the housing market, but it is not exactly racing out of the blocks in 2024.
We still see weakness in the top end of the market. Demand remains relatively healthy but supply is much stronger than in 2023, especially for homes over $2 million. Cave Creek is doing better, but is recovering from very weak 4Q of 2023.
The healthiest segment is the mid-range, especially in locations closer to the center of Greater Phoenix. This includes Phoenix itself, plus Chandler, Gilbert, Glendale, Mesa, Tempe, Avondale and Peoria. Several of the most distant and more affordable areas are getting rather more supply than seller's would like. A prime example is Casa Grande.
10 out of 17 cities are seller's markets. We have 3 cities that are balanced and 4 are buyer's markets, with Goodyear joining Queen Creek, Buckeye and Maricopa.
Feb 13 - Using the contract ratio to see which locations are hot right now, we find Tolleson way out in front. At 135 it is one of only two cities of any size that have a contract ratio over 100. El Mirage is the second with a reading of 134 which has risen dramatically over the past week. These are both inexpensive locations that are not too far out, which seem to be the most in favor at this particular point in time.
Also sporting high contract ratios are Apache Junction (95), Chandler (87), Laveen (87), Glendale (82), Gilbert (80), Tempe (78), Mesa (77) and Sun Lakes (75).
At the bottom of the pack is Paradise Valley with a contract ratio of 20. Cave Creek is at 33, Goodyear is 35, Scottsdale is 36, Gold Canyon 40 and Maricopa 44. These areas are cool on a supply versus demand basis. In some (such as PV and Scottsdale) it is because we have an unusually strong supply of new high-end listings. In others, it is because we have a much healthier supply of homes for sale than in the valley as a whole.
We normally expect lower priced areas to show a higher contract ratio, and vice-versa. On this basis, Goodyear and Maricopa stand out as cooler than expected.
Feb 11 - The percentage of list price that sellers achieve with the contract price is up from 96.61% a year ago to 97.58% today. This reflects a more positive mood than we were seeing a year ago. At 117.5 the Cromford® Market Index is slightly lower than it was last year (120.8) and it is not showing much momentum in either direction, while last year it was moving steadily higher.
Messages from the data are giving us mixed signals. The signals are weak too. Demand is improving but so is supply. Normally this would lead to greater volume but any growth in sales is so slow that it is almost imperceptible, when seasonality is taken into account.
Last year we saw 60.6% growth in listings under contract on February 11 compared with the start of the year. This year the growth is 59.9%, very slightly worse and starting at a lower base point.
Altogether there is not much to get excited about if you are longing for positive movement. On the other hand, there is also not much to get excited about if you are hoping for the market to crash. I have nothing to satisfy either of these positions.
Arizona is famous for its boom and bust real estate cycles, but at this moment it is very much stuck in neutral.
Feb 8 - Here is our latest table of Cromford® Market Index values for the single-family markets in the 17 largest cities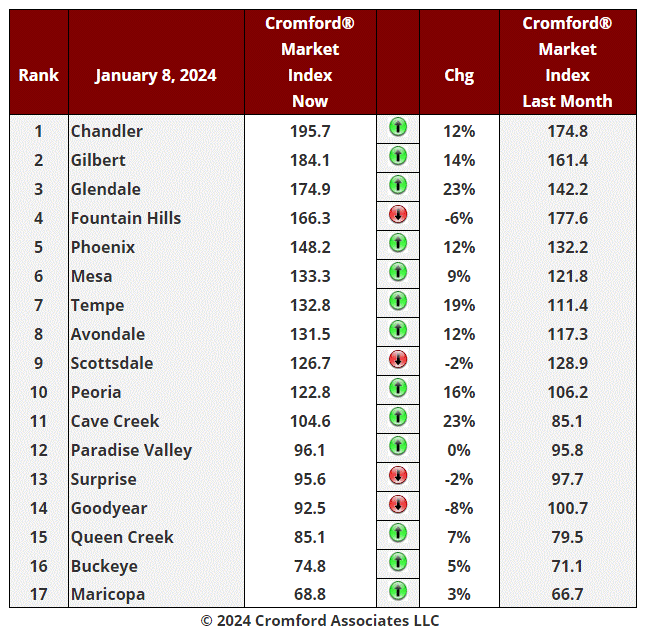
The market is getting more diverse with some segments slowing down while other are improving for sellers. We still have 13 cities showing an increase in their Cromford® Market Index over the past month, but 4 have deteriorated and several more are starting to decline. Scottsdale and Surprise have joined Fountain Hills and Goodyear in posting s decline in the last month. Also falling in the last week are Buckeye, Maricopa and Paradise Valley.
There has been an average increase of 8.1% in the Cromford® Market Index for the 17 cities, down from the 10.5% we recorded last week. We are still seeing a positive change over the month but the trend is slowing and this is not what sellers want to see at this time of year. Supply is growing in the more expensive locations and also in several of the cheapest and most distant areas from Central Phoenix. Paradise Valley has over 200 active listings without a contract for the first time since 2020. Cave Creek has bounced back after a worrying spell well below 100 but is also seeing inventory starting to grow.
Once again doing well over the last month are mid-range areas that are not too far from the center of the valley. These include Glendale, Tempe, Chandler, Gilbert and Peoria, as well as Phoenix itself. These markets are looking healthy in terms of supply versus demand, although transaction volume remains poor.
10 out of 17 cities are seller's markets. We have 4 cities that are balanced and 3 that remain buyer's markets.
Feb 7 - The good news is that the annual sales rate has stopped falling. The bad news is that it has not started rising.
We appear to be stuck at the very low rate of between 72,100 and 72,600 closed listings per year across all areas & types. Just 2 years ago we were at 110,000, so we are missing some 38,000 deals compared with then.
Mortgage interest rates have been rising again for the last 3 weeks, so a volume breakout is looking unlikely in the short term.
If we were sailors we would call this the doldrums.vvv
Feb 5 - The Affidavits of Value recorded during January by Maricopa County have now been analyzed and show us the following:
There were 4,745 closed transactions, up 3.8% from 4,571 in January 2023 but down 5.2% from December.
There were 1,089 closed new homes, up 10% from 988 in January 2023 but down 21% from December.
There were 3,656 closed re-sale transactions, up 2% from 3,583 in January 2023 and up 0.9% from December.
The overall median sales price in January was $455,000, up 3.4% from January 2023 but down 1.1% from December.
The re-sale median sales price was $439,000, up 4.5% from January 2023 but down 0.2% from December.
The new home median sales price was $499,990, down 1.1% from January 2023 and down 1.1% from December.
Sales counts were again weak in January, though re-sales were slightly higher than December, which is unusual.
Prices were moderately higher than a year ago for re-sales and the market as whole, but the new home median was lower than last year, mainly because the typical new home is smaller than it was in January 2023.
In summary we have price stability and a low-transaction count, with the new home market taking a higher share of the market (23%) than normal. Three years ago new homes were less than 15% of the total units sold.
These numbers are for single family and townhouse / condo homes.
Feb 1 - Here is our latest table of Cromford® Market Index values for the single-family markets in the 17 largest cities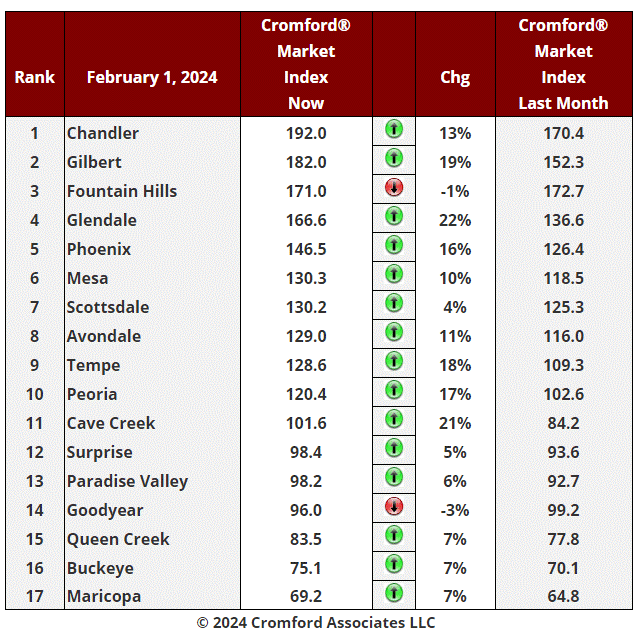
The chart is no longer all-green and the situation is getting interesting. We still have 15 cities showing an increase in their Cromford® Market Index over the past month, but a few of these have seen a decline in the most recent week. These include Scottsdale, Surprise and Maricopa.
There has been an average increase of 10.5% in the Cromford® Market Index for the 17 cities, down from the 12.4% we recorded last week. The reason is that supply is mounting rapidly in the more expensive locations and also in some of the cheapest and most distant areas from Central Phoenix. Faring very well over the last month are mid-range areas that are not too far from the center of the valley. These include Glendale, Tempe, Chandler, Gilbert and Peoria, along with Phoenix itself. These markets are looking remarkably strong and price increases are to be anticipated here.
It is a different story at the top end of the market, which has been flooded with new listings over the past month. The higher up the price range you go, the more the supply has increased. Paradise Valley has more single-family homes available now than at any time since November 2020. Carefree has the most homes available since July 2020 while Rio Verde has the most since December 2017. Some sellers in these up-scale areas are facing stiff competition from other sellers and it would not be surprising if we see significant price cuts among some of these listings. We have 71 single-family homes priced at $10 million or more. Given that we have never seen more than 29 such listings closed in a single 12-month period, this is a lot of supply. Sellers may need to be either very patient or flexible.
10 out of 17 cities are seller's markets. We have 4 cities that are balanced and 3 that remain buyer's markets.
Among the secondary cities, Anthem, Apache Junction and Tolleson are out-performing by a long way, but El Mirage, Litchfield Park, Sun City West, Sun Lakes and Laveen are weakening and Gold Canyon is already weak at 80.2.
Casa Grande is very weak indeed and has the lowest CMI at 67.8 and trending lower. Buyers are very much in control in Casa Grande.
Jan 30 - The latest S&P / Case-Shiller® Home Price Index® numbers were published this Tuesday.
The new report covers home sales during the period September to November 2023. This means the typical home sale closed in mid October, more than 3 months ago. Please remember that Case-Shiller data is fairly old, even on the day it is released.
We have 7 of the 20 cities showing rising prices for last month, with a lower index for Phoenix for the first time in 9 months. 13 cities declined over the last month with Seattle the most affected.
Comparing with the previous month's series we see the following changes:
Miami +0.3%
Cleveland +0.3%
New York +0.3%
Charlotte +0.2%
Las Vegas +0.2%
Tampa +0.1%
Los Angeles +0.1%
Atlanta 0.0%
Boston -0.2%
Washington -0.3%
Phoenix -0.3%
Chicago -0.4%
Detroit -0.4%
San Diego -0.5%
Dallas -0.6%
Minneapolis -0.8%
Denver -0.9%
Portland -1.0%
San Francisco -1.3%
Seattle -1.4%
Phoenix has dropped from 2nd to 11th place since last month. The national average increase month to month was -0.18%, so Phoenix fell just below that standard.
Comparing year over year, we see the following changes:
Detroit +8.2%
San Diego +8.0%
New York +7.4%
Cleveland +7.4%
Los Angeles +7.2%
Miami +7.2%
Boston +7.1%
Chicago +7.0%
Minneapolis +7.0%
Atlanta +5.9%
Washington +4.7%
Tampa +3.4%
Minneapolis +2.7%
Phoenix +2.5%
Las Vegas +2.1%
San Francisco +2.0%
Dallas +1.7%
Seattle +1.6%
Denver +1.5%
Portland -0.7%
Phoenix has crept up from 18th to 14th place, but is still in the bottom half on a year over year basis. 19 of the 20 cities are now showing positive price movement from one year ago and Portland is again doing relatively poorly.
The national average is +5.1% year over year. Phoenix is showing less than half that percentage.
Jan 29 - The Cromford® Market Index has reached a plateau just above 117 and shows little momentum beyond that.
Sellers seem to have lost the reticence they developed last year and are delivering plenty of new supply. 8,278 new listings have been posted in the last 4 weeks. This is the highest total since October 20, 2022 and represents a 16% increase over this time last year. The CMI is stationary because demand and supply are both increasing in step. Which one will become dominant in February?
Jan 28 - The number of active listings without a contract has crept above 16,000 again. This is still low compared with a normal market, but a strong flow of new listings is creating a small rise from the low point of 14,593 that we saw at the start of the year. With a low closing rate of close to 4,000 per month, this is a healthy level of supply. However, demand continues to rise, with listings under contract up 43% in those same 4 weeks. It would be reasonable to expect the active supply level to peak at this point and start to fall again once February gets under way.
Jan 25 - Here is our latest table of Cromford® Market Index values for the single-family markets in the 17 largest cities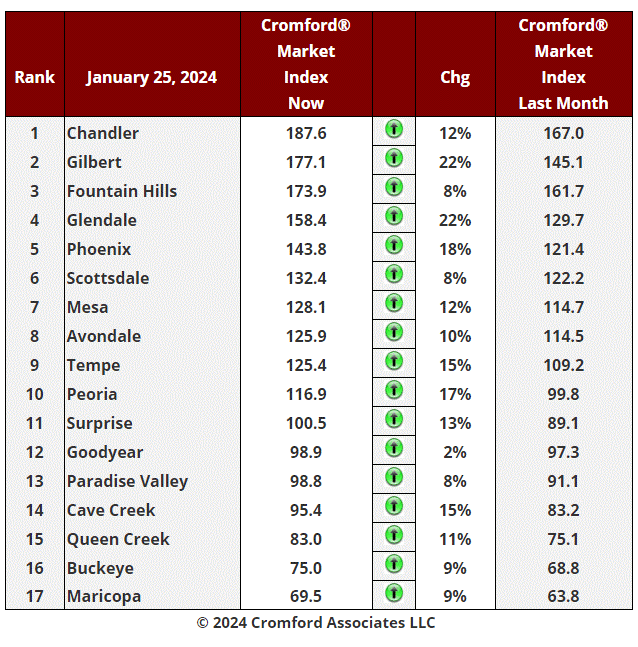
Yet another all-green chart with 17 cities showing an increase in their Cromford® Market Index over the past month.
There has been an average increase of 12.4% in the Cromford® Market Index for the 17 cities, a strong rise but down slightly from yje 12.6% we recorded last week. The drop in interest rates that started in October is bringing more offers for homes listed for sale. However there are also far more new listings arriving on the market than this time last year, which is stopping the market from heating up too fast. Year to date we have seen 7,467 new listings. This is up more than 22% from 2023 and even up 13% from 2022 and 10% from 2021. Nobody should be complaining about a lack of fresh supply any more, especially in the higher price ranges.
Demand is improving even faster, with 7,428 listings under contract, up 41% compared with the beginning of 2024. The monthly sales rate is still stuck around 4,000 because that depends on contracts signed during December which were unusually weak. We should start to see improving closing volumes in February.
Leading the pack once again are Gilbert, Glendale, Surprise, Phoenix and Peoria. The laggards include Goodyear, Scottsdale, Fountain Hills and Paradise Valley. The top end of the market is seeing a lot of new supply.
10 out of 17 cities are seller's markets. We have 4 cities that are balanced and 3 that remain buyer's markets, with Buckeye and Maricopa seeing a large amount of competition with supply from new home builders.
With demand and supply both increasing, we should see a recovery in transaction volumes and firm pricing, without the risk of runaway appreciation. However sentiment remains uncertain and volatile, so it would be wise not to look away for very long, or the situation may catch you by surprise. Of course, the Cromford® Report will not be looking away at all. We remain obsessed with this stuff.
Jan 21 - The average price per square foot of active listings just hit a new all-time high of $366.43 yesterday. This surpassed previous peaks set in May 2022 and June 2023.
Active listings are arriving in much larger numbers than last year, when they were unusually scarce. The new listing arrival rate is back to normal, but the seller's expectations seem to be unusually positive, judging by the asking prices. The average $/SF has risen 2.1% in just the last two weeks. These figures are averaged across all areas & dwelling types.
Jan 20 - A few cities have seen a sharp rise in their contract ratio over the past 2 weeks. The percentage increases for single-family detached homes are shown in the table below:
1. Apache Junction +64% to 94
2. Anthem +47% to 71
3. Arizona City +47% to 57
4. Gilbert +46% to 65
5. Sun Lakes +45% to 59
6. Chandler +43% to 72
7. Tempe +31% to 53
8. Peoria +31% to 49
9. Gold Canyon +30% to 32
These are the locations that have experienced the most rapid improvement in demand versus supply.
A handful have gone backwards:
1. Fountain Hills - down 11% to 36
2. Laveen - down 15% to 67
3. Goodyear - down 7% to 33
4. Sun City West - down 5% to 36
5. Phoenix is up 18% to 48.
In most areas, a contract ratio over 40 is consistent with a seller's market. More expensive locations tend to have lower contract ratios, so Paradise is only 21, (up 20%), while Scottsdale is 30 (up 15%).
The contract ratio is one of the leading indicators of a change in the market.
Jan 18 - Here is our latest table of Cromford® Market Index values for the single-family markets in the 17 largest cities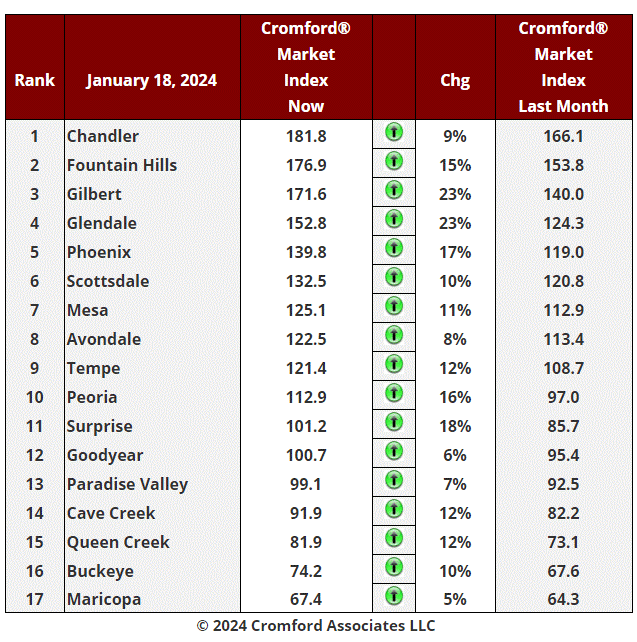
Another all-green chart with 17 cities showing an increase in their Cromford® Market Index over the past month.
There has been an average increase of 12.6% in the Cromford® Market Index for the 17 cities, a rapid rise and even more positive than the 10% increase we recorded last week. The implication is that the drop in interest rates started in October is finally bringing more offers for homes listed for sale. As is normal in January, new listings are also arriving in stronger numbers, but the total supply remains well below normal. In addition the demand appears to rising at a significantly faster rate than the supply.
Leading the pack this week are Gilbert, Glendale, Surprise, Phoenix and Peoria. The laggards include Maricopa, Goodyear and Paradise Valley, but even these are higher than last week.
10 out of 17 cities are seller's markets. We have 4 cities that are balanced and only 3 that remain buyer's markets, with Cave Creek escaping that zone over the last week.
Sales volume remains very low, but closings are always very week in January due to the dearth of new contract signings in December. The precursor of a recovery is strong growth in new contracts. These numbers are by no means amazing but they do seem to be increasing at a healthy pace and in a pattern reminiscent of a normal sellers' market. Moderate optimism seems to be in order and this is reflected in the most recent home builder confidence survey. The NAHB / Wells Fargo Housing Market Index has jumped from a very weak 34 in November to 37 in December and 44 in January. A year ago it stood at only 31, so home builder sentiment is trending higher fast but is yet to reach the heights of last Summer when it stood in the mid-50s.
Jan 11 - Here is our latest table of Cromford® Market Index values for the single-family markets in the 17 largest cities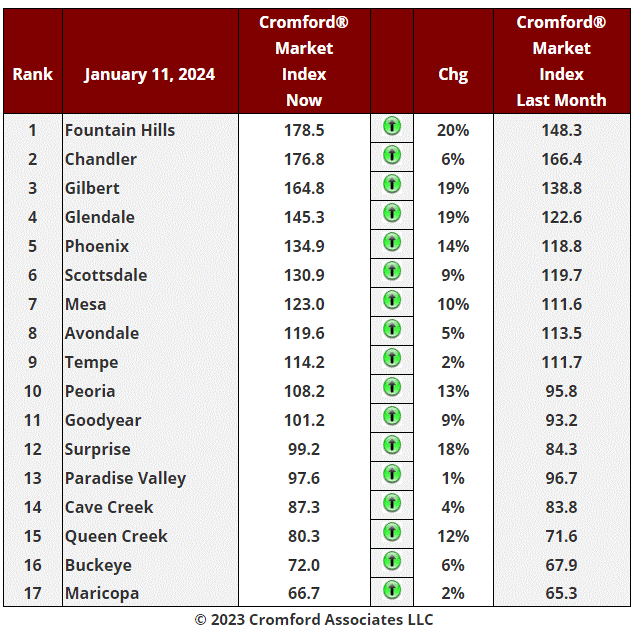
In a development that will bring joy to sellers and dismay to housing-crash forecasters, all 17 cities are now showing an increase in their Cromford® Market Index over the past month.
There has been an average increase of 10% in the Cromford® Market Index for the 17 cities, significantly more positive than the 6% increase we recorded last week. The trend in favor of sellers is accelerating as listings go under contract at a faster rate and supply remains well below normal..
Leading the charge are Fountain Hills, Gilbert, Glendale and Surprise. The laggards include Tempe, Maricopa, Cave Creek, Avondale, Buckeye and Paradise Valley, but even these are now improving for sellers.
9 out of 17 cities are seller's markets. We have 4 cities that are balanced and 4 that remain buyer's markets.
Last week we recommended mild to moderate optimism for the month of January, and this can be modified to remove the reference to mild. It is a good start to the year and transaction volumes appear likely to start improving if this trend holds. We will be examining annual sales counts and looking for stability followed by a gentle increase.
Jan 10 - Expanding on yesterday's observation, the bar chart below ranks the cities by the 2 year change in the annual average price per square foot for closed listings, measured at the end of 2023.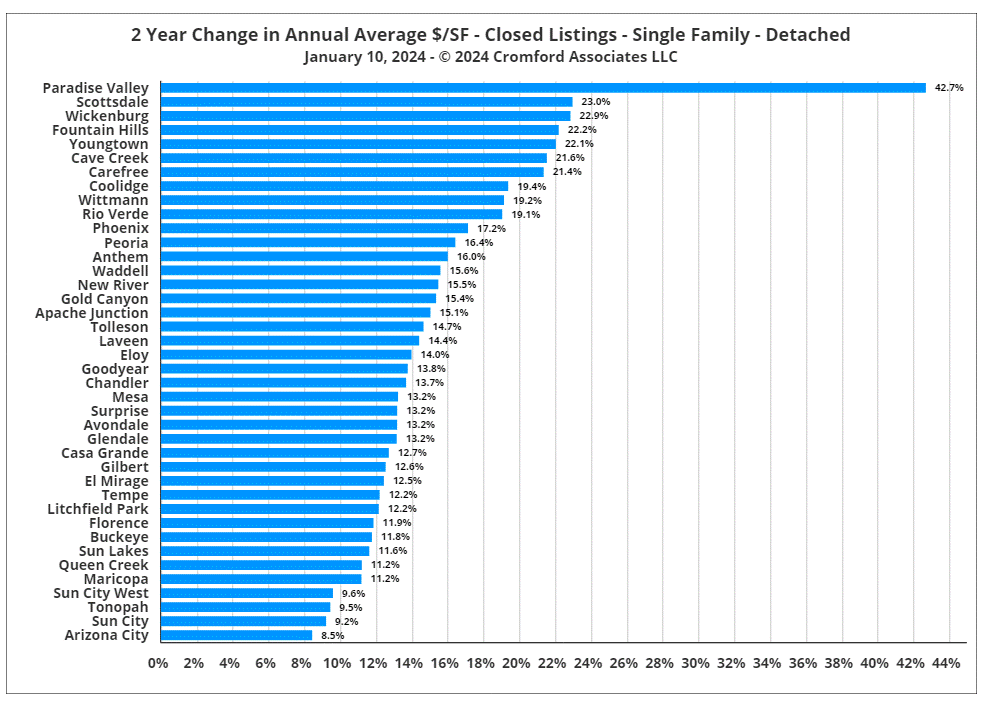
Paradise Valley is way out in front with an increase of over 42%. Other cities with a healthy proportion of luxury homes appear close to the top, including Scottsdale, Fountain Hills, Cave Creek, Carefree and Rio Verde.
Arizona City prices have risen the least - though still up 8.5% over the 2 years. The 55+ areas were also slower movers, with Sun City, Sun City West and Sun Lakes all below 12%.
The outer areas are a mixed bag, with Wickenburg, Coolidge, Wittmann, Rio Verde, Anthem, Waddell and New River all in the upper ranges. In contrast Arizona City, Tonopah, Queen Creek, Buckeye and Florence did relatively poorly.
This is the first time since 2000 that we have seen Paradise Valley accelerate well ahead of the pack. It probably has something to do with the number of homes that are torn down and replaced with new builds that have extremely high costs per square foot. This process extends the gap between Paradise valley and Scottsdale home pricing.
Jan 9 - Throughout the last year it has become more and more obvious that the top-end of the market is behaving differently from the entry-level and the mid-range.
Using a long-term average smooths out the data, a very necessary thing for studying the high-end where sample sizes are very low. For example there were no sales over £10 million in December, so the sample set was null for that month.
Above $2,000,000 we see that the annual average $/SF is higher than a year ago, but below $2,000,000 it is lower. The cheaper you go the more 12-month average prices tend to have fallen.
Homes above $10 million have become more expensive and at the fastest rate. Homes between $300,000 and $400,000 have seen their annual average $/SF drop over the last month by more than other price ranges.
We rarely see such a clear pattern, so I conclude that something is bolstering the luxury market. It is not lack of supply, which is plentiful, although active listing counts are not excessive compared to the normal levels at these altitudes. It seems that luxury buyers have been less affected by the high interest rates which appear to have had a much more serious effect on first-time home buyers.
Jan 7 - The Affidavits of Value recorded during December by Maricopa County have now been analyzed and show us the following:
There were 5,007 closed transactions, down 13% from 5,758 in December 2022 but up 2.5% from November.
There were 1,385 closed new homes, down 18% from 1,685 in December 2022 but up 14% from November.
There were 3,622 closed re-sale transactions, down 11% from 4,073 in December 2022 and down 1% from November.
The overall median sales price in December was $460,000, up 2.2% from December 2022 but down 1.1% from November.
The re-sale median sales price was $440,000, up 4.8% from December 2022 but down 1.6% from November.
The new home median sales price was $506,330, down 2.9% from December 2022 but up 0.3% from November.
Sales counts were weak again in December, with re-sales even lower then November, which is unusual.
Prices were moderately higher than a year ago for re-sales and the market as whole, but the new home median was lower than last year, mainly because the typical new home is smaller than it was in 2022.
These numbers are for single family and townhouse / condo homes.
Jan 4 - Here is our latest table of Cromford® Market Index values for the single-family markets in the 17 largest cities
The same 4 cities as last week are showing red, and the same 13 cities are seeing their Cromford Market Index increase since December 4. However, there has been an average increase of 6.0% in the Cromford® Market Index for the 17 cities, significantly more positive than the 2.0% increase we recorded last week. The means the trend in favor of sellers is starting to accelerate.
Fountain Hills, Surprise, Glendale, Queen Creek and Gilbert are seeing the biggest improvement of 11% or more.
9 out of 17 cities are now seller's markets. We have 4 cities that are balanced and 4 that are buyer's markets. Maricopa is still trailing but it starting a recovering trend having hit a low of 63.7 on December 25.
The very mild optimism that was the order of the day in December is starting to look well-justified. We recommend mild to moderate optimism for the month of January, at least as far as market balance is concerned. Transaction volumes remain subdued but are more likely to recover if the market balance stays favorable to sellers..
Jan 1 - The Cromford® Market Index is moving higher, partly because the count of active listings declined during December (as expected) and partly because there is a slight increase in demand. This increase in demand is very muted however. We did see an small upward move in the closing rate over the last 2 weeks but there has also been a large fall in the number of listings under contract.
Jan 1 - The Cromford® Market Index is moving higher, partly because the count of active listings declined during December (as expected) and partly because there is a slight increase in demand. This increase in demand is very muted however. We did see an small upward move in the closing rate over the last 2 weeks but there has also been a large fall in the number of listings under contract. This is because the closings have taking a big chunk out of the pipeline that has not been replaced by new contract signings.
We are starting 2024 with one of the lowest counts of listings under contract we have ever recorded for the start of any year (5,127). We measured 5,456 last year and 9,393 in 2022. We have to go back all the way to the dark days of 2008 to find a lower count (3,468). 2007 was also very bad, but at 5,197 it just beats the 2024 reading.
With interest rates much lower than 2 months ago, we may start to see more accepted contract activity in the next few weeks. We normally get a lot of new listings in January too, so at this stage it is too early to tell whether supply or demand will grow the fastest. The next 3 weeks will be very important in establishing which trend is dominant.
Dec 28 - Here is our latest table of Cromford® Market Index values for the single-family markets in the 17 largest cities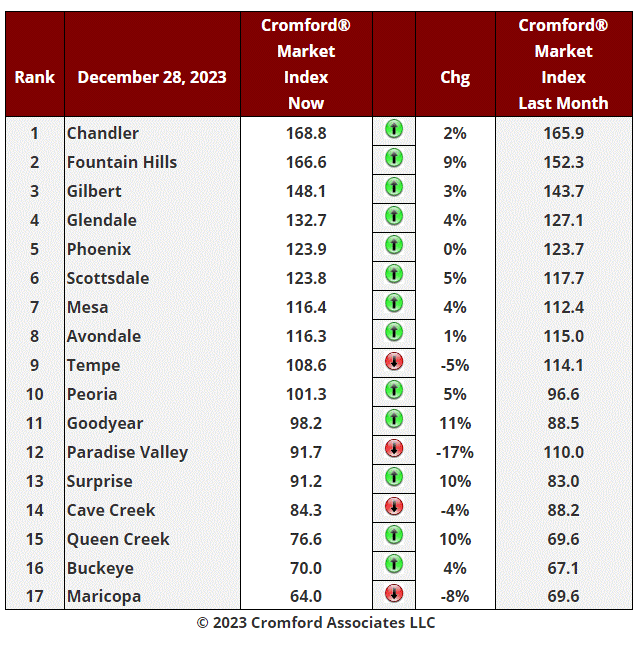
The table is now dominated by green with 13 cities seeing their Cromford Market Index increase since November 28. There has been an average increase of 2.0% in the Cromford® Market Index for the 17 cities, significantly more positive than the 3.0% decline we recorded last week, confirming the trend in favor of sellers..
Only Paradise Valley, Tempe, Cave Creek and Maricopa are still showing declines over the last month with Goodyear, Surprise and Queen Creek seeing the biggest improvement of 10% or more.
8 out of 17 cities are now seller's markets. We have 5 cities that are balanced and 4 that are buyer's markets. Maricopa is still trailing but appears have turned around, having hit a low of 63.7 on December 25..
Dec 26 - The latest S&P / Case-Shiller® Home Price Index® numbers were published this Tuesday.
The new report covers home sales during the period August to October 2023. This means the typical home sale closed in mid September, more than 3 months ago. Please remember that Case-Shiller data is fairly old, even on the day it is released.
We have 11 of the 20 cities showing rising prices for last month, with a higher index for Phoenix for the eighth month in a row. However 9 cities declined over the last month with Portland the most affected.
Comparing with the previous month's series we see the following changes:
1. Miami +0.6%
2. Phoenix +0.6%
3. New York +0.5%
4. Los Angeles +0.4%
5. Boston +0.3%
6. Detroit +0.3%
7. Las Vegas +0.3%
8. Charlotte +0.3%
9. Chicago +0.2%
10. Atlanta +0.2%
11. Cleveland +0.2%
12. Tampa -0.0%
13. San Diego -0.1%
14. Washington -0.3%
15. Dallas -0.3%
16. Minneapolis -0.3%
17. Seattle -0.5%
18. Denver -0.6%
19. San Fransisco -0.6%
20. Portland -0.9%
Phoenix has risen from 5th to 2nd place since last month. The national average increase month to month was +0.17%, so Phoenix remains well ahead of that standard.
Comparing year over year, we see the following changes:
1. Detroit +8.1%
2. San Diego +7.2%
3. New York +7.1%
4. Chicago +6.9%
5. Miami +6.7%
6. Boston +6.6%
7. Cleveland +6.4%
8. Los Angeles +6.1%
9. Charlotte +6.0%
10. Atlanta +5.3%
11. Washington +4.7%
12. Minneapolis +2.8%
13. Tampa +2.3%
14. San Francisco +1.6%
15. Denver +1.6%
16. Seattle +1.5%
17. Dallas +1.2%
18. Phoenix +0.9%
19. Las Vegas +0.1%
20. Portland -0.6%
Phoenix has crept up from 19th to 18th place, but still among the weakest cities on a year over year basis. 19 of the 20 cities are now showing positive price movement from one year ago and once again most of the northern cities are looking good on the year over year measure, along with Southern California.
The national average is +4.8% year over year.
Once again there is no evidence of either a local or national housing price crash over the last 12 months. Only Portland is showing a small decline from 12 months ago.
Dec 23 - The monthly average price per sq. ft. across all areas & types in the ARMLS database is up 6.4% from 12 months ago. $266.78 has moved to $283.87.
Many of the so-called real estate pundits on YouTube and elsewhere were predicting a massive crash of up to 70% (yes, seriously) for Phoenix housing. They did not do this because they have a deep understanding of how the housing market works (obviously). They did it because predictions of disaster catch people's attention, generate views and therefore advertising revenue for Google and the video publisher. There is no shame involved.
You may be wondering what these pundits do when their older videos are proven to be so massively wrong by the real world. They just delete their older videos and publish the same predictions for the next year. Repeat again and again.
Some have been doing this for many years and there always seem to be enough new viewers gullible enough to keep watching their crazy predictions. Being consistently wrong for several years does not seem to dampen their enthusiasm for making videos. They must like the income I suppose. By deleting all their videos more than 3 months old, they hide how appalling their forecasting ability has been shown to be. In the wider economic world, there are many book authors in the same mold who sell lots of books but get their predictions wrong year after year. Harry Dent springs immediately to mind, but there are lots more.
The Cromford® Report market commentary is based on actual data, careful statistical mathematical calculation and over 20 years of experience measuring the Phoenix market. We never delete any of our materials. You can check what we said against what actually happened.
During the first quarter, several subscribes wrote to us and said we might be too optimistic, but the numbers never lie to us. The housing market has survived intact and is now in better health price-wise than it was this time last year, though admittedly we could all do with a lot more transaction volume. These emails were valuable to me because I took them as a signal that public perception was much worse than reality, even for experienced and highly competent professionals.
The last 200 years years have shown us that for home prices to go significantly down, we have to have an excess of homes for sale chasing too few buyers. Right now, buyers are indeed thin on the ground, but we still have overall supply well below normal and heading lower. For a housing crash we would need a flood of new homes for sale. The reason it might occur is not important, but without this flood, price will remain stable at worst.
Supply is going down, but this is normal for December every year. The important stuff will happen in January. Will more than the usual number of buyers emerge due to falling mortgage rates, or will we see a surge in new listings. The balance between these two measures will determine the direction of prices in the first quarter of 2024 and anyone who tells you they already know what will happen is selling you a lie.
The future is largely unknown, but at least we can understand the present properly. The Cromford® Market Index is in the balanced zone around 105 and increasing slightly. To conclude we have any credible evidence of an imminent crash would be simply illogical.
Dec 21 - Here is our latest table of Cromford® Market Index values for the single-family markets in the 17 largest cities
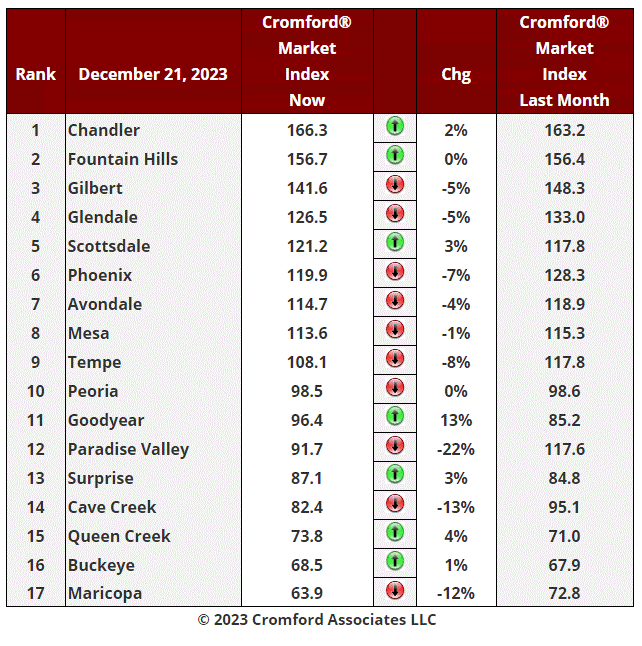
There has been an average decline of 3.0% in the Cromford® Market Index for the 17 cities above over the last month. This is a big improvement over the 6.7% decline we saw last week, but the average CMI is still somewhat lower than a month ago. However the average CMI has not fallen over the past week has risen by 1% and we are now officially in a recovery trend.
Moving up over the past month, Scottsdale, Goodyear and Chandler have been joined by Fountain Hills, Surprise, Queen Creek and Buckeye. Only Paradise Valley, Cave Creek and Maricopa are still showing double-digit percentage declines over the last month.
8 out of 17 cities are still seller's markets. We have 4 cities that are balanced and 5 that are buyer's markets. Maricopa stands out as by far the weakest market of the 17 and it has yet to turn around..
Dec 21 - If we are prepared to use completed ARMLS rental listings as our source, then the average rent in Greater Phoenix has been stuck between $1.32 and $1.43 per sq. ft. per month since July 21, almost two and a half years ago. The 12 month moving average is $1.35 and the reading for December 2023 is currently $1.32. Given that inflation has been running hot during this period, the effective cost of renting has come down relative to average incomes, which have definitely increased (though not for everyone, especially some of those working in real estate whose income depends on transaction volumes).
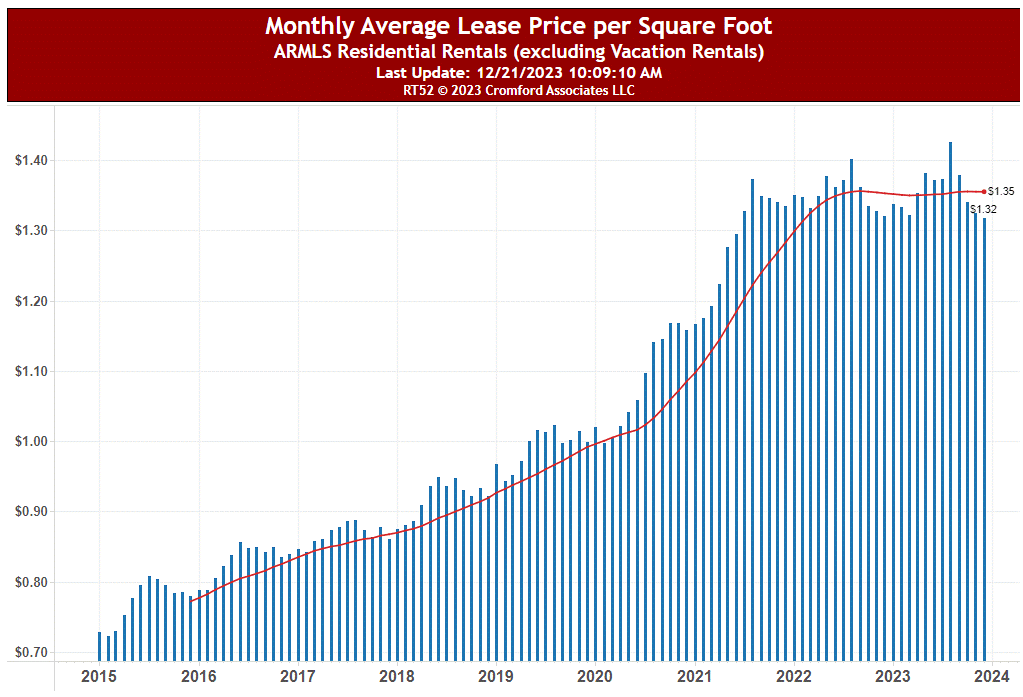
The interactive version of this chart is available here.
This could be interpreted as making renting more attractive than buying. The Economist, Wall Street Journal and New York Times have recently come out with articles concluding exactly that.
This is based on comparing the monthly cost of renting versus the monthly cost of a typical mortgage. The shift has been dramatic, because rents have gone down in real terms (relative to the value of the dollar), while home prices and interest rates have both risen much faster than inflation. This is a key reason why demand to buy a home is low right now. We can see from the multi-family permit charts in Cromford® Public that developers have created a huge number of new apartments to cope with the rental demand along with an increasing number of build-to-rent single-family homes and condos. This massive additional supply has stopped rents rising.
But this is not the complete story. There are many benefits and costs associated with owning a home that are not taken into account by that analysis of the basic monthly expenses. These can completely swamp the monthly cost numbers, but building them into a model is often tricky and requires forecasts of the future value of a home, which is fraught with uncertainty at any time. If you rent, the landlord is the one who benefits from any appreciation in the asset but is also responsible for much of the costs of ownership, such as property tax, maintenance, HOA dues, building insurance, etc. For the past 80 years, real-estate has appreciated in value, except for a few temporary isolated periods. There are always some pundits calling for a massive fall in prices, but 95% of the time they are proven wrong. By renting, you are forgoing any chance of sharing in the benefits of appreciation, or indeed the costs of ownership.
In an analysis of household wealth, we find the most significant component of net worth is usually the equity that household has built up in either the home they live in or the homes they invested in to rent out as landlords, or both. You rarely find households with significant net worth living in rented accommodation, unless they intend to move somewhere else within the next couple of years. A telling statistic is that the net worth of the average homeowner is 44 times that of the average tenant.
The advantage of owning over renting is smaller now than it was a few years ago, but unless you plan to stay in a property less than 4 years, it is usually financially beneficial to buy if you possibly can. Just make sure you can afford the repayments before you jump, because buying a home and losing it to foreclosure is definitely unhealthy for your finances.
Dec 18 - We are still waiting for the annual sales count to give us some encouraging sign.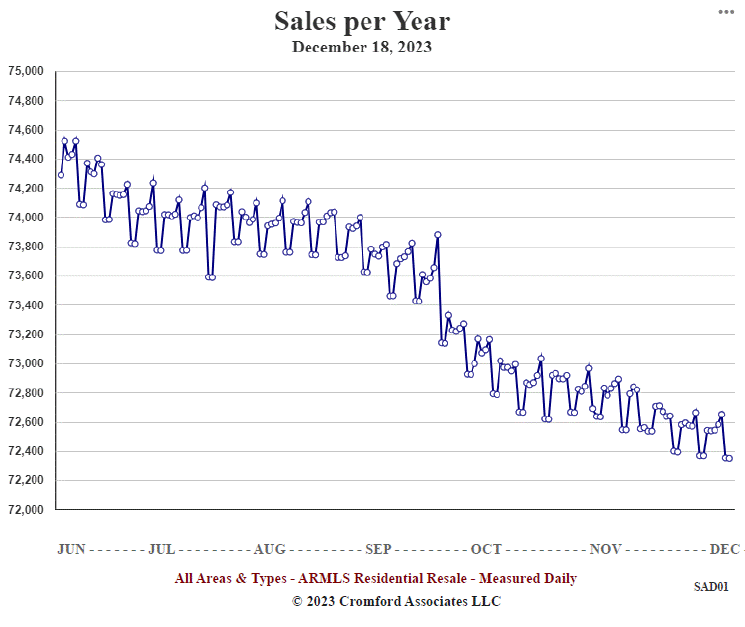
In a good strong market this number is over 100,00. We are currently below 72,600 and despite the improving interest rate picture, the annual sales rate is drifting slightly lower. This measure is free of seasonal effects, because it measures a whole year of sales activity, so if the market is improving we should see a rising trend, no matter what time of year. Admittedly closed sales counts are a trailing indicator, but it would be reasonable to expect something better than 73,000 if the market is starting to recover its mojo.
The general opinion seems to be that things will improve in January. If this chart starts to move higher, we will start to believe that opinion has merit. Right now we wait to be convinced.
Dec 16 - The Cromford® Market Index for all areas & types appears to have finished its decline and has settled around 104, in the balanced zone between 90 and 110. In fact it reached a low point of 104.0 last Monday and Tuesday and has eased up up 104.2 today.
This partly because the Demand Index has stopped declining and partly because the Supply Index has stopped rising. They are all showing little inclination to move at the moment and we probably won't get much action, or feel for direction, until we get into the second week of January.
Perhaps surprisingly, the lower interest rates have not brought a lot of new signings. The number of homes under contract is only 5,777 today, the lowest count since January 8 and well below the 6,333 we measured the same time last year. Yesterday's rate for 30-year fixed loans was 6.64%, while the 30-year FHA rate was 6.14%. These are much lower than a month ago and far below the rates in mid to late October.
It is entirely possible that buyers are waiting for January rather than committing themselves to house-hunting during December.
With the CMI above 100, we should not be seeing significant weakness in pricing, so I hope buyers are not waiting for overall price drops. Individual listings give us price cuts all the time, but these are balanced by new listings coming in at higher levels. Any price weakness is likely to be concentrated in the areas with the lowest CMI, such as Maricopa, Buckeye, Queen Creek (including San Tan Valley), Cave Creek and Surprise. Among the smaller cities, Casa Grande, Gold Canyon and Sun City look the weakest. In contrast we see strength building in Apache Junction and Litchfield Park.,
Dec 14 - Here is our latest table of Cromford® Market Index values for the single-family markets in the 17 largest cities
There has been an average decline of 6.7% in the Cromford® Market Index for the 17 cities above over the last month. This is an improvement over the 9.9% decline we saw last week, but the average CMI is still significantly lower than a month ago.
We are watching to see which cities start to move in a positive direction, and this week Scottsdale has joined Goodyear and Chandler. But others, like Paradise Valley, Cave Creek, Maricopa, Glendale and Phoenix are still showing double-digit percentage declines over the last month.
Given how much interest rates have fallen since October - and the typical 30-year fixed rate is down to 6.62% today - everyone seems to be expecting the housing market to react very positively. Indeed home-builder's stocks have been on a rampage. Our housing market numbers tell a much less exciting story. Demand has edged slightly higher in quite a few places, but given the extremely low monthly sales rates, it would take a very long time to get back to normal at the current rate of improvement. Supply normally declines sharply between Thanksgiving and New Year's Eve, but in 2023, it is barely declining at all. The market reaction to the lower rates is so-far underwhelming.
9 out of 17 cities are still seller's markets, though Tempe, Mesa and Avondale are only a tad higher than the balanced zone. We have 3 cities that are balanced and 5 that are buyer's markets. Maricopa stands out as the weakest market of the 17 with buyers have a strong negotiation advantage in that city, thanks to its plentiful supply.
Dec 11 - After an unexpectedly strong interval in November, closed prices have fallen back to an average around $285 per sq. ft. and are now slightly lower than they were 2 months ago.
However, the average $/SF for listings under contract has not dropped and is still holding the line at $325. We always expect any unusually wide gap between the green line and the brown line to get smaller.
The overall market is now close to balance but some areas in a buyer's market and other's in a seller's market. In these conditions the most likely result is for pricing to remain very calm.
Those expecting and/or hoping for strong price moves either up or down are probably going to be disappointed. Conditions would need to change a lot for either event to occur.
Dec 10 - An interesting trend jumps out from one of the charts in our Cromford Public section: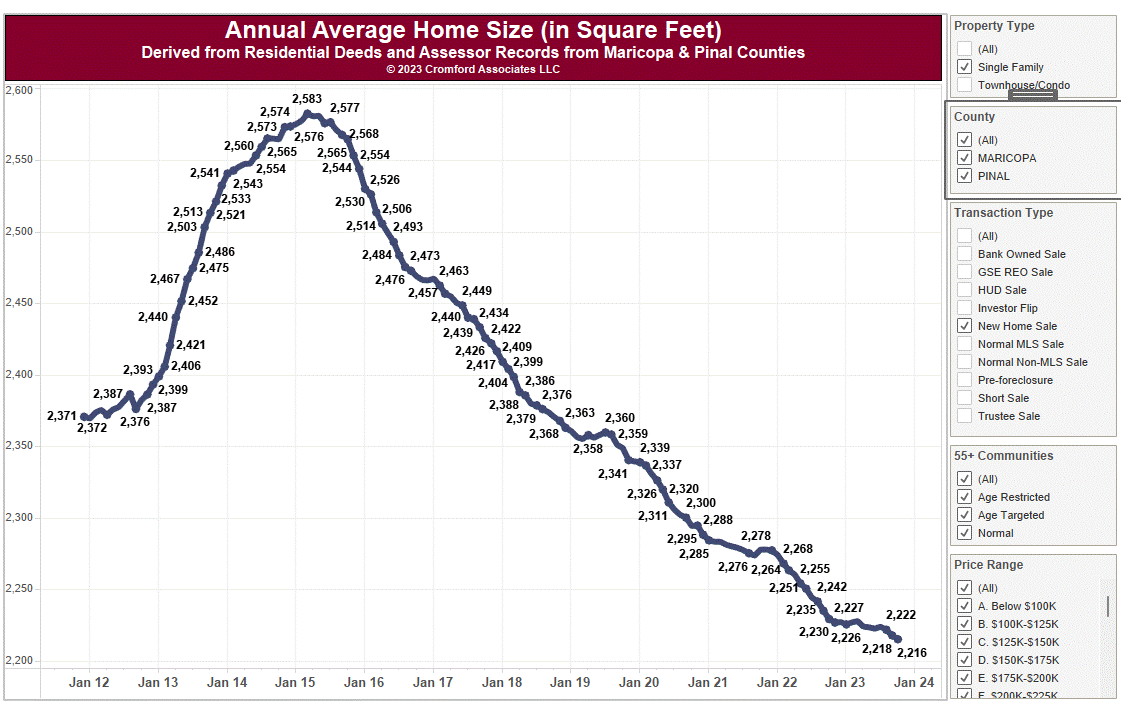
This is New Home Sales for single-family only and shows that the annual average size of a new home peaked in March 2015 and has been dropping almost every month since then. In October 2023 the annual average was 2,216 sq. ft., which is down 367 sq. ft. 14% from the peak. When looking at the median or average price of a new home, please take into account that new homes bought recently will on average be significantly smaller than those bought earlier.
The same does not apply to new townhouse / condo properties, which typically average 1,700 sq. ft. and are on a gentle upward trend since 2013.
Dec 7 - Here is our latest table of Cromford® Market Index values for the single-family markets in the 17 largest cities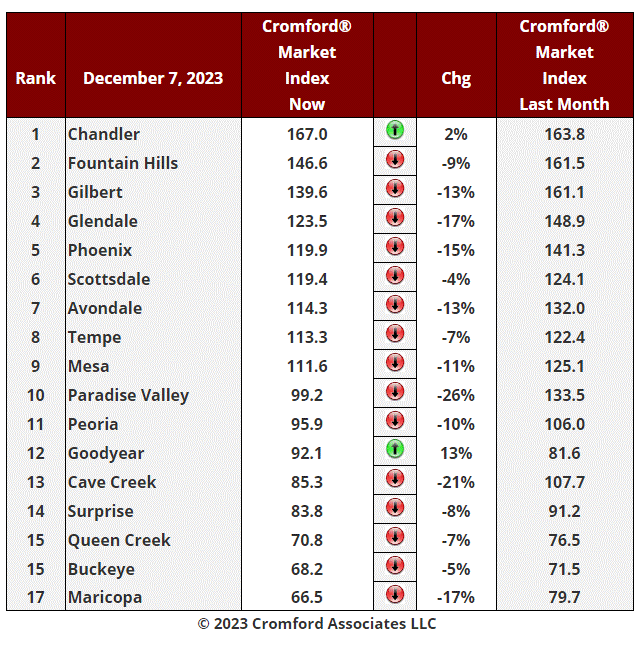
There was an average decline of 9.9% in the Cromford® Market Index for the 17 cities above. This is an improvement over the 13.1% decline we saw last week, but it is still a negative move. We a watching to see which cities start to move in a positive direction. So far we have Goodyear which has raised its CMI an impressive 13% and is now back in the balanced zone after spending 55 days as a buyer's market. Chandler has also shown an improvement over the last month, but this is a less impressive 2%. However it gets credit for staying at the top of the table and its lead over Fountain Hills has opened up significantly.
The remaining 15 cities have all moved down, with Paradise Valley collapsing by 26% and now below 100. Cave Creek, Glendale and Maricopa are also heavily down and the all-important Phoenix is down 15%. Demand is clearly picking up, but not as energetically as you might expect after almost 100 basis points have been lopped off the 30-year fixed mortgage rate. We hear that purchase applications for mortgages jumped 35% last week, but this is from an extremely low level.
A few cities have seen their CMI move higher in the last week: Surprise, Buckeye, Avondale, Queen Creek, Mesa and Scottsdale. However, some of this is due to the usual seasonal weakening of supply and cannot be fully credited to stronger demand.
9 out of 17 cities are still seller's markets with Paradise Valley, Goodyear and Peoria in the balanced zone while Cave Creek, Surprise, Buckeye, Queen Creek and Maricopa are all buyer's markets. Maricopa and Buckeye have dropped below 70, so buyers have a strong advantage in these locations.
So in summary. we are seeing gradual improvement in the demand trend, and supply is no longer increasing in most areas.
Dec 6 - Despite high mortgage rates and reports of delinquency problems in car loans and credit cards, the vast majority of borrowers are keeping current with their mortgage payments.
Serious delinquencies on home loans fell to a 17-year low in October, according to Black Knight Financial Services. Although national foreclosure starts jumped to their highest level in 18 months, they are still 25% below pre-pandemic levels.
You can check the pending foreclosures for Maricopa County in our foreclosure chart, but I can save you the time. The is nothing interesting to see. We are still below 1,000 pending foreclosures, which for a county as large as Maricopa, is a very small number.
Dec 5 - The Affidavit of Value recorded during November by Maricopa County have now been analyzed and show us the following:
There were 4,887 closed transactions, down 8% from 5,333 in November 2022 and down 12% from October.
There were 1,220 closed new homes, down 11% from 1,364 in November 2022 and down 18% from October.
There were 3,667 closed re-sale transactions, down 8% from 3,969 in November 2022 and down 10% from October.
The overall median sales price in December was $465,000, up 2.2% from November 2022 and up 0.3% from October.
The re-sale median sales price was $447,000, up 4.0% from November 2022 and up 0.6% from October.
The new home median sales price was $505,050, down 4.7% from November 2022 and down 0.7% from October.
New home sales were weaker in November and the median price was down too. However the average size of a new home has been falling and this accounts for about half of the median price drop since November 2022. November is always a weak month for closings, especially new homes. Many builders tend to focus on closings by year end and quarter end, rather than mid-quarter.
The re-sale market remained very quiet, with prices holding up well.
These numbers are for single family and townhouse / condo homes.
Dec 2 - The typical 30-year fixed mortgage rate has dropped significantly since October, falling from 7.92% on October 30 down to 7.09% as of December 1.
You might have expected this significant drop in the cost of buying a home to result in a jump in the number of people contracting to do so. There have been some reports of a jump in mortgage applications, but as far as the ARMLS database is concerned, the number of listings under contract is distinctly underwhelming - 5,817 as of December 2 and still well below the 2022 number.
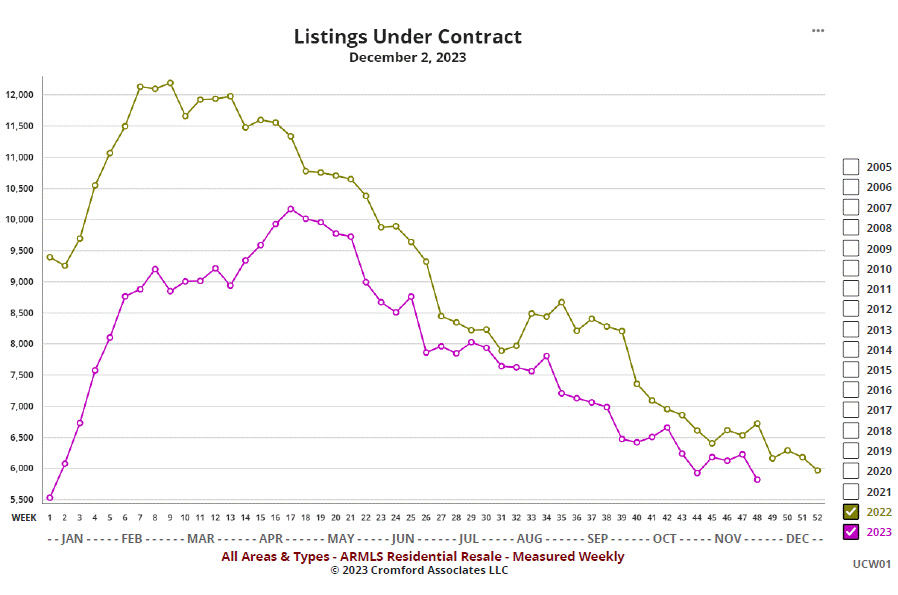
A few areas have perked up, but others have shown no enthusiasm at all and overall I would describe buyer's reaction to the reduced rates as very muted.
Perhaps they are waiting for the new year?
Nov 30 - Here is our latest table of Cromford® Market Index values for the single-family markets in the 17 largest cities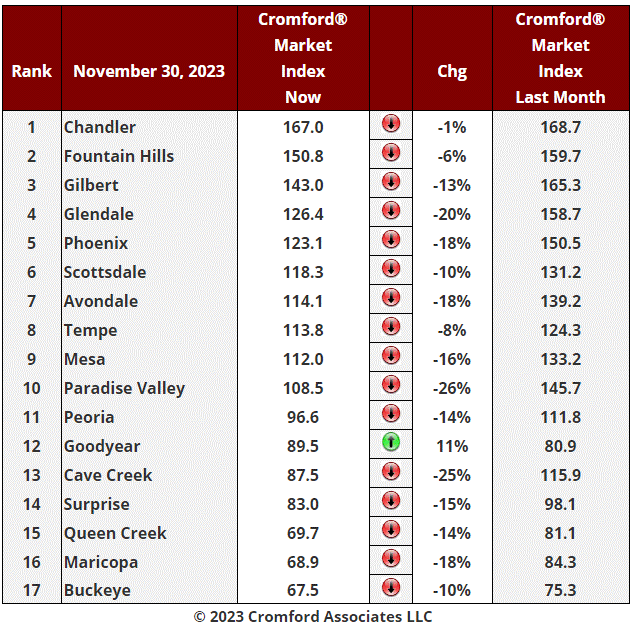
There was an average decline of 13.1% in the Cromford® Market Index for the 17 cities above. This is an improvement over the 15.2% decline we saw last week, and a more substantial improvement than last week.
The majority of cities were worse than average, including Paradise Valley, Cave Creek, Glendale, Phoenix, Surprise, Mesa, Peoria, Maricopa, Queen Creek and Avondale.
Once again, Goodyear stands out as the only major city that saw its CMI improve over the last month. and it has almost escaped its buyer's market and resumed a balanced status. Also doing relatively well are Chandler, Fountain Hills and Tempe. Scottsdale and Buckeye have improved over the last week
9 out of 17 cities are still sellers markets with Paradise Valley and Peoria in the balanced zone while Cave Creek, Surprise, Buckeye, Goodyear, Queen Creek and Maricopa are all buyers' markets. Maricopa, Queen Creek and Buckeye have dropped below 70, so buyers have a strong advantage in these locations. The situation for sellers is worse because there is so much competition from new home builders in these areas.
We are seeing gradual improvement in the demand trend, and supply has finally stopped increasing in most areas, which is what we expect to see once Thanksgiving is over..
Nov 28 - The latest S&P / Case-Shiller® Home Price Index® numbers were published this Tuesday.
The new report covers home sales during the period July to September 2023. This means the typical home sale closed in mid August, more than 3 months ago.
We have 15 of the 20 cities showing rising prices for last month, with a higher index for Phoenix for the seventh month in a row. However 5 cities declined over the last month.
Comparing with the previous month's series we see the following changes:
1. Detroit +0.68%
2. New York +0.62%
3. Las Vegas +0.60%
4. Miami +0.59%
5. Phoenix +0.54%
6. Tampa +0.54%
7. Boston +0.47%
8. Charlotte +0.46%
9. Cleveland +0.33%
10. Chicago +0.27%
11. Los Angeles +0.19%
12. Washington +0.13%
13. Atlanta +0.10%
14. San Francisco +0.06%
15. San Diego +0.05%
16. Dallas -0.13%
17. Denver -0.35%
18. Portland -0.41%
19. Minneapolis -0.43%
20. Seattle -0.53%
Phoenix has risen from 6th to 5th place since last month. The national average increase month to month was +0.30%, so Phoenix remains comfortably ahead of that standard.
Comparing year over year, we see the following changes:
1. Detroit +6.7%
2. San Diego +6.5%
3. New York +6.3%
4. Chicago +6.0%
5. Boston +5.3%
6. Los Angeles +5.2%
7. Cleveland +5.1%
8. Miami +5.0%
9. Charlotte +4.7%
10. Washington +4.4%
11. Atlanta +4.3%
12. Minneapolis +2.4%
13. Tampa +1.5%
14. Denver +1.0%
15. Seattle +0.9%
16. San Francisco +0.5%
17. Dallas +0.3%
18. Portland -0.7%
19. Phoenix -1.2%
20. Las Vegas -1.9%
Phoenix lies once again in 19th place, and among the weakest cities on a year over year basis. 17 of the 20 cities are now showing positive price movement from one year ago and once again the northern cities are looking good on the year over year measure, along with Southern California.
The national average is +3.9% year over year.
We can see that Phoenix pricing has been much weaker than the national average between 3Q 2022 and 3Q 2023.
We can also see that those predicting a nationwide housing crash over the 12 months were wrong. No surprise there.
Nov 25 - Here is the weekly chart of active listing counts for all areas & types for 2022 and 2023: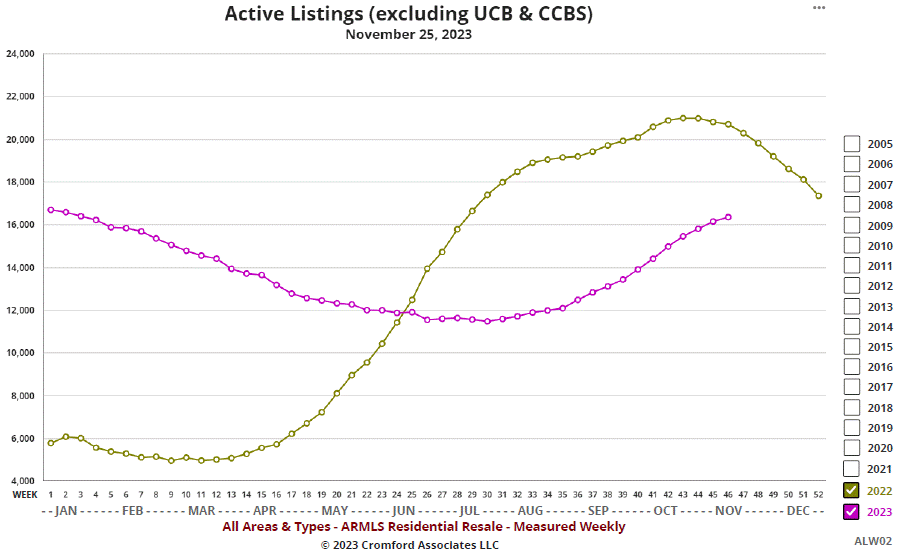
We can see that the count has not yet stopped rising although the rate of increase is slowing down. Last year we saw the count decline from early November. We appear destined to end 2023 with supply roughly the same as we started in January, around the 16,000 mark.
So far, demand is showing only a weak positive response to lower interest rates and the overall market is in a balanced situation, with seller's still having an advantage in the most sought-after locations while buyers have the edge at the fringes.
Prices continue to hold up well, probably because we don't see the widespread fear that dominated market sentiment 12 months ago. However 12 months ago we were at a turning point where the situation started to improve, while right now we are waiting for the market to stop deteriorating.
Nov 23 - Here is our latest table of Cromford® Market Index values for the single-family markets in the 17 largest cities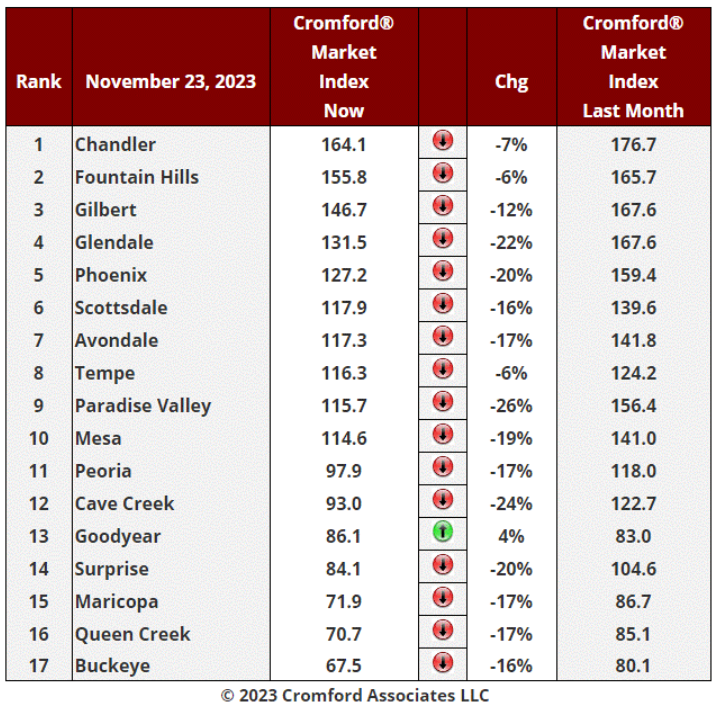
There was an average decline of 15.2% in the Cromford® Market Index for the 17 cities above. This is an improvement over the 16.1% decline we saw last week, but not a very big one.
The majority of cities were worse than average, including Paradise Valley, Cave Creek,Glendale, Phoenix, Surprise, Mesa, Peoria, Maricopa, Queen Creek, Avondale, Scottsdale and Buckeye.
Goodyear stands out as the only major city that saw its CMI improve over the last month. Also doing relatively well are Tempe, Fountain Hills and Chandler.
10 out of 17 cities are still sellers markets with Peoria and Cave Creek in the balanced zone while Surprise, Buckeye, Goodyear, Queen Creek and Maricopa are all buyers' markets. Maricopa and Queen Creek are below the 80 level and Buckeye has dropped below 70.
We are seeing a little improvement in the demand trend, but supply continues to increase in most areas, which is unusual for the third week of November.
Nov 20 - After the recent fall in mortgage interest rates, it is reasonable to expect some signs of a recovery in demand. That is likely to show up in the number of listings under contract.
Can we see any signs of improvement? Yes - November is looking slightly better than October, taking the low level at the end of October into account. In fact it has the best monthly profile since May.
Are we impressed? No, not really. We are still stuck below 6,600 listings under contract and that is far below normal for the time of year. It would take some solid growth before the end of 2023 before we would count ourselves impressed. Finishing the year comfortably over 7,000 would do that, but I am not holding my breath.
Nov 19 - The Cromford® Market Index for all areas & types has fallen from 113.9 to 109.4 over the last 7 days and is now within the balanced zone of 90 to 110.
It is currently still in a downward trend with supply rising and demand falling. Seasonal patterns make it likely that this downtrend will flatten out over the next 6 weeks, but we will have to wait and see if this materializes.
Nov 16 - Here is our latest table of Cromford® Market Index values for the single-family markets in the 17 largest cities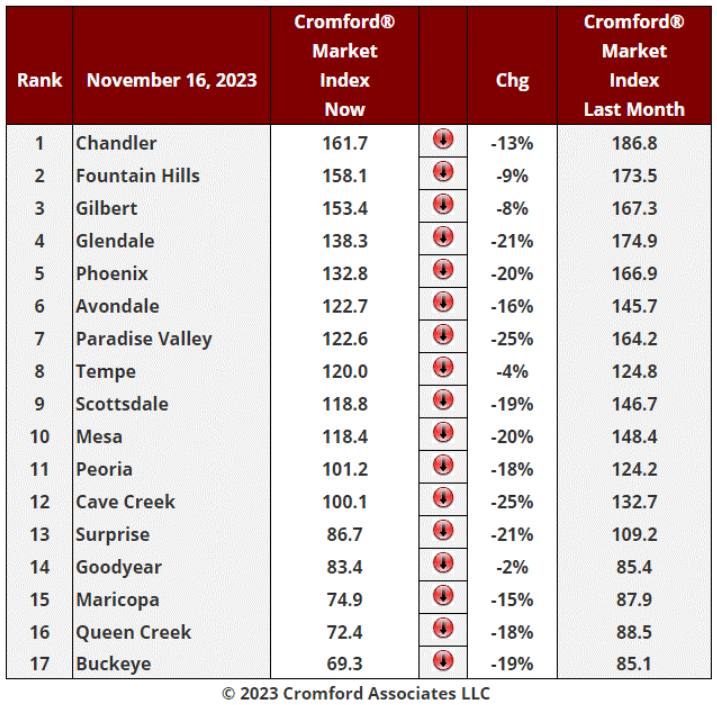
There was an average decline of 16.1% in the Cromford® Market Index for the 17 cities above. This is slightly less bad than the 16.3% decline we saw last week.
Well above average declines in CMI can be seen in Cave Creek, Buckeye, Mesa, Scottsdale, Glendale, Paradise Valley, Surprise and Phoenix. The slowest declines are to be found in Goodyear and Tempe. In fact Goodyear has started to see its CMI rise over the past week.
10 out of 17 cities are still sellers markets with Peoria and Cave Creek in the balanced zone while Surprise, Buckeye, Goodyear, Queen Creek and Maricopa are all buyers' markets. Maricopa and Queen Creek are below the 80 level and Buckeye has dropped below 70.
Nov 15 - We have the first signs that demand is starting to recover, thanks to the lower mortgage rates that now prevail. Today we are looking at 7.45% for a typical 30-year fixed loan and 6.77% for FHA. These are still not great rates, but preferable to the 7.88% and 7.31% that prevailed on October 31.
Today's contract ratio for all areas & types is 40.56, up from 37.46 on November 4. It is still lower than a month ago, but the trend has changed direction. It had been in clear decline between late May and early November.
Supply usually weakens each year once we get to Thanksgiving. If demand can hold its current trend, then we are optimistic that the weakening market can stabilize by the end of the year. Of course, all bets are off if interest rates move higher again.
Nov 13 - The monthly table of 41 cities ranked by annual average $/SF has been published today.
It is striking how far Paradise Valley has moved in a positive price direction (12.7%) over the past 12 months, opening up an even wider gap with the rest of Greater Phoenix. Scottsdale has also moved slightly higher by 1.3%, but Paradise Valley is now priced at 71% higher than Scottsdale, up from a 54% premium last year.
Wittmann and Youngtown, both tiny and therefore subject to volatility, are the only other cities showing a positive move over the past 12 months, based on the ANNUAL average $/SF. The monthly average $/SF for these locations is close to useless because of the small sample size for sales in a single month.
At the other end of the scale, Arizona City, Sun City West, Sun City, Tonopah, Queen Creek, Avondale, Florence and Surprise have seen the largest declines in their average $/SF, down more than 5%. We conclude that the huge rise in mortgage rates has negatively affected the lower priced areas on the perimeter of the valley more than the luxury locations and those closer to the center.
Nov 9 - Here is our latest table of Cromford® Market Index values for the single-family markets in the 17 largest cities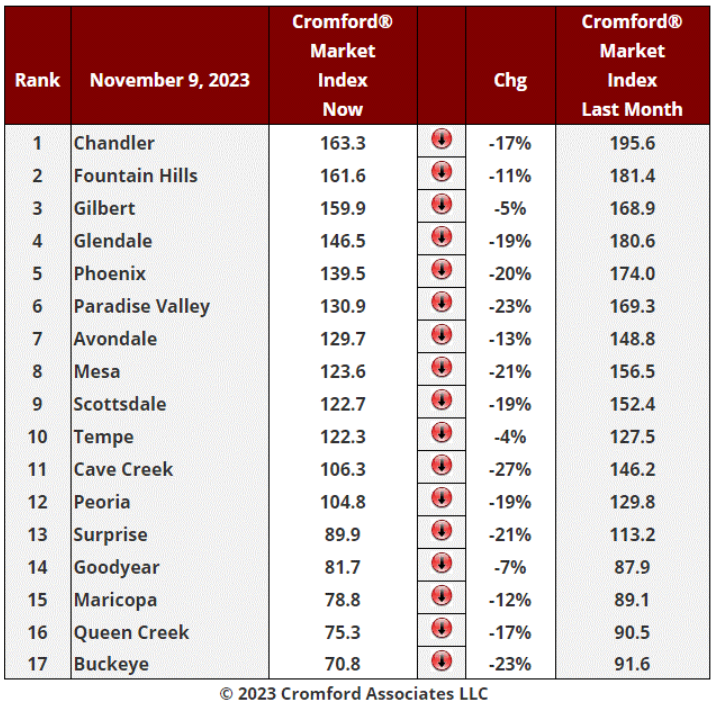
Based on the numbers in this table. the market is still weakening at a fast rate, with an average decline of 16.3% in the Cromford® Market Index for the 17 cities above. This is worse than the 15.8% decline we saw last week.
Well above average declines in CMI can be seen in Cave Creek, Buckeye, Mesa, Scottsdale, Paradise Valley, Surprise and Phoenix. The slowest declines are to be found in Gilbert, Goodyear and Tempe.
10 out of 17 cities are still sellers markets with Peoria and Cave Creek in the balanced zone while Surprise, Buckeye, Goodyear, Queen Creek and Maricopa are all buyers' markets. Maricopa has joined Queen Creek and Buckeye below the 80 level. Among the secondary cities, Casa Grande and Gold Canyon are also below 80 while Litchfield Park is below 90.
Tolleson, Laveen, Sun Lakes, Anthem, El Mirage and Apache Junction are the strongest of the secondary cities, all with CMIs over 180.
Despite the above, we are just starting to see a slight tick-up in some of the listings-under-contract numbers, as the market reacts to the very recent decline in mortgage rates since the start of November.
Nov 6 - Despite the plunging Cromford® Market Index, pricing trends have been largely favorable over the past 2 months. Here is the 6 month chart showing daily readings for the active listing average $/SF, under contract average $/SF, closed list price average $/SF and closed sale price average $/SF.
The active listing $/SF is lower than it was 6 months ago, but that follows the usual seasonal pattern with a weak 3Q followed by a mild recovery. The current trend is pretty flat with optimistic new listing prices being balanced by price cuts for existing listings that remain on the market for more than a few weeks.
Under contract $/SF is a lot higher than it was 6 months ago, around $320 compared with $302, a rise of around 6%. However the trend for the last month has flattened.
The list $/SF for closed listings stands at $303, up from $287 six months ago, a rise of just under 6%.
The sale $/SF for closed listings stands at $297, up from $280 six months ago, a rise of just over 6%.
Closed listings are achieving a slightly higher percentage of the final asking price compared with 6 months ago. It is up from 97.58% to 97.97%, a positive sign.
Since the end of August the gap between the under contract line (green) and the closed line (brown) has been too big. When this happens, it is safe to predict the gap will close. In this case, prices for closed listings rose significantly while under contract prices remained stable. The gap is now back to normal. Closed prices are unlikely to rise much further from this point unless under contract prices establish an upward trend again. Given the balance between supply and demand, it seems more likely that under contract pricing will weaken, but we will have to wait and see what recent moves in interest rate do to buyer enthusiasm.
Nov 3 - The Affidavit of Value recorded during October by Maricopa County have now been analyzed and show us the following:
There were 5,543 closed transactions, down 8% from 6,019 in October 2022 and down 6% from September.
There were 1,480 closed new homes, up 5% from 1,410 in October 2022 but down 9% from September.
There were 4,063 closed re-sale transactions, down 12% from 4,609 in October 2022 and down 5% from September.
The overall median sales price in October was $470,000, unchanged from October 2022 and up 4.4% from September.
The re-sale median sales price was $445,000, down 0.6% from October 2022 but up 1.1% from September.
The new home median sales price was $538,422, up 1.8% from October 2022 and up 12% from September.
New home sales have remained resilient and grew year over year, despite the extremely weak demand in the re-sale market.
Unlike the last 2 months, the new home numbers were not impacted by large buy-to-rent transactions with low unit prices. Consequently the new home median sales price jumped to $538,422, the highest we have ever recorded. It is not that there were no BTR transactions in September - they were just sold at more normal new home prices.
These numbers are for single family and townhouse / condo homes
Nov 2 - Here is our latest table of Cromford® Market Index values for the single-family markets in the 17 largest cities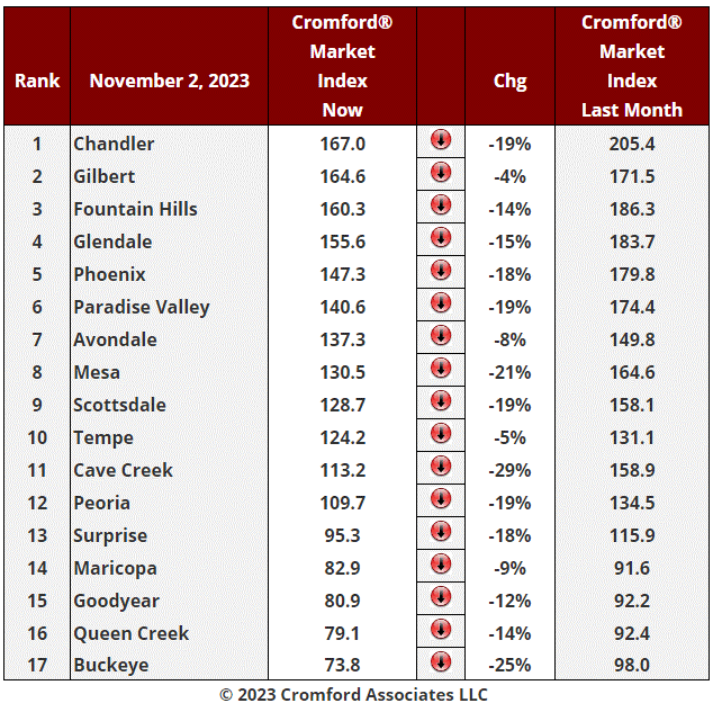
The market is still weakening and at a faster rate, with an average decline of 15.8% in the Cromford® Market Index for the 17 cities above. This is worse than the 14.5% decline we saw last week.
Well above average declines in CMI can be seen in Cave Creek, Buckeye, Mesa, Scottsdale, Paradise Valley, Chandler, Peoria , Surprise and Phoenix. Falling but at a lower speed are Gilbert, Avondale, Maricopa and Tempe.
11 out of 17 cities are still sellers markets with Peoria and Surprise in the balanced zone while Buckeye, Goodyear, Queen Creek and Maricopa are all buyers' markets. Queen Creek has joined Buckeye below the 80 level. Among the secondary cities, Casa Grande is also below 80 while Gold Canyon and Litchfield Park are below 90.
Tolleson, Laveen, Anthem, El Mirage and Apache Junction are the strongest of the secondary cities with CMIs over 190.
Oct 31 - The latest S&P / Case-Shiller® Home Price Index® numbers were published this Tuesday.
The new report covers home sales during the period June to August 2023. This means the typical home sale closed in mid July, more than 3 months ago.
We have 13 of the 20 cities showing rising prices for last month, with a higher index for Phoenix for the sixth month in a row. However 7 cities declined slightly over the last month.
Comparing with the previous month's series we see the following changes:
1. Miami +1.21%
2. Las Vegas +1.10%
3. Detroit +0.81%
4. Charlotte +0.77%
5. Atlanta +.76%
6. Phoenix +0.67%
7. Boston +0.60%
8. San Diego +0.58%
9. New York +0.50%
10. Los Angeles +0.45%
11. Tampa +0.38%
12. Seattle +0.18%
13. Chicago +0.04%
14. Denver -0.06%
15. Washington -0.08%
16. Minneapolis -0.12%
17. Portland -0.12%
18. Dallas -0.18%
19. Cleveland -0.20%
20. San Francisco -0.47%
Phoenix has fallen from 2nd to 6th place since last month. The national average increase month to month was +0.43%, so Phoenix remains comfortably ahead of that standard.
Comparing year over year, we see the following changes:
1. Chicago +5.0%
2. New York +5.0%
3. Detroit +4.8%
4. San Diego +4.1%
5. Cleveland +3.9%
6. Atlanta +3.4%
7. Washington +3.4%
8. Miami +3.3%
9. Los Angeles +3.2%
10. Boston +3.1%
11. Charlotte +3.0%
12. Minneapolis +1.9%
13. Tampa +0.0%
14. Denver -0.6%
15. Portland -1.5%
16. Seattle -1.5%
17. Dallas -1.7%
18. San Francisco -2.5%
19. Phoenix -3.9%
20. Las Vegas -4.9%
Phoenix lies in 19th place, the same as last month and among the weakest cities on a year over year basis. 13 of th 20 cities are now showing positive price movement from one year ago and once again the northern cities are looking good on the year over year measure.
The national average is +2.6% year over year.
We can see that Phoenix pricing has been much weaker than the national average between 3Q 2022 and 3Q 2023.
Oct 30 - Although the market is weakening quickly, you couldn't tell from the closed listing prices we are recording: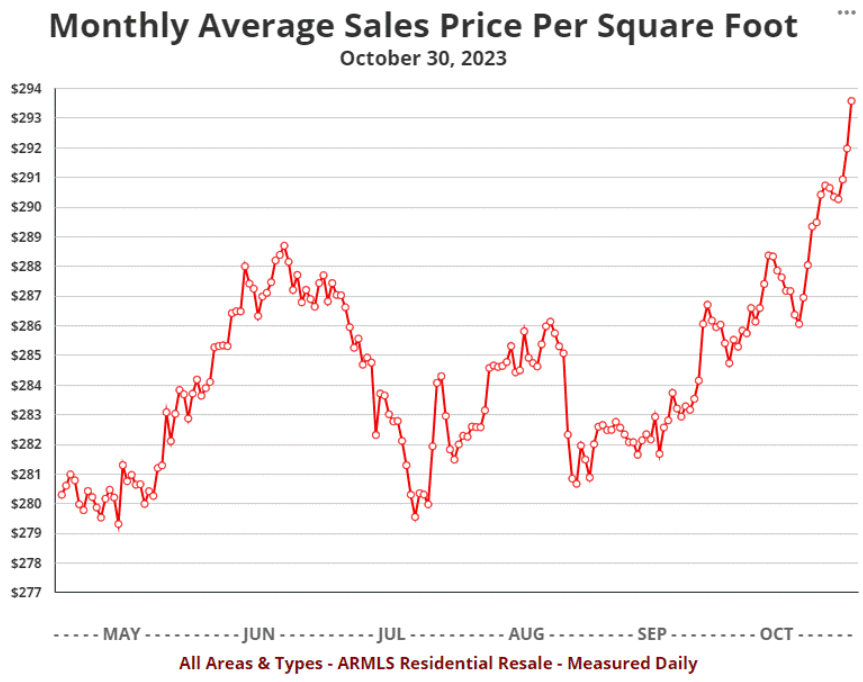
Breaking through the $293 level for the first time since July 12, 2022, this chart gives us the impression of a market in robust health.
This underlines the fact that sales pricing, even when measured every day, is very much a trailing indicator. Many of these prices were established in contracts agreed a few months ago when the Cromford® Market Index was still over 160, representing a strong seller's market with declining inventory. Sales volumes have also held up better in the luxury market than at the opposite end of the market, where first time buyers are having difficulty affording a mortgage. This bias towards the higher end pushes the average $/SF upwards.
The leading indicators, such as the CMI, contract ratio, days of inventory and listing success rate are all reflecting the recent step down in demand and the rapid rise in active listings.
This situation also shows us how poor the S&P / Case-Shiller® Home Price Index is in representing the current state of the market. Not only is the index a trailing indicator, it is 2 to 3 months behind the chart above because it uses a 3-month average for sales that closed between 2 and 5 months ago.
Oct 28 - Active listing counts are rising at the second fastest rate we have ever witnessed for late October. Since the low point of 11,473 (excluding UCB and CCBS) in late July they have climbed almost 35% and are rapidly approaching 16,000. The only year which saw a faster rate was 2005: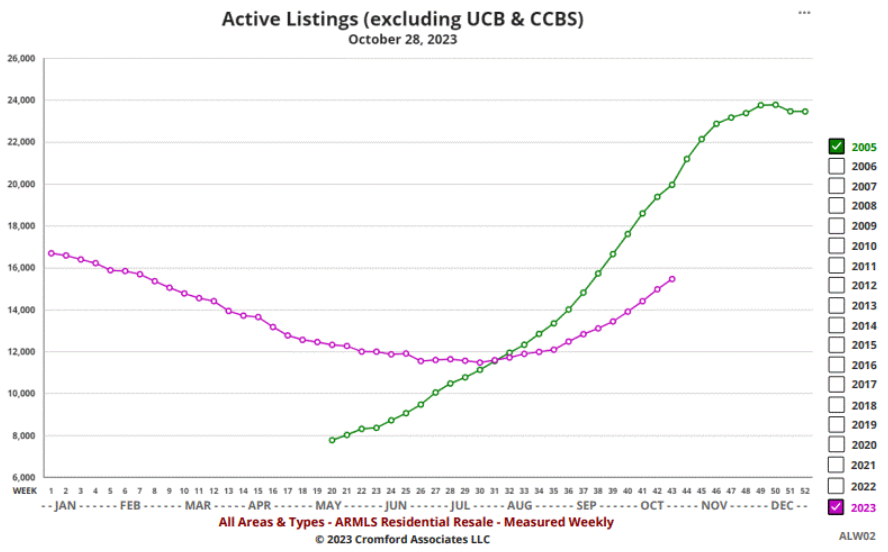
2005 saw an increase of almost 80% during the same period, so we are not in that territory. But the increase in available supply is making life more difficult for sellers since they now have to compete far more aggressively for the relatively few buyers out there.
As you might expect, price cuts have risen sharply since July and we are recording well over 2,000 cuts per week. As recently as September, we were seeing fewer than 1,500.
Oct 26 - Here is our latest table of Cromford® Market Index values for the single-family markets in the 17 largest cities
The market is weakening at a faster rate, with an average decline of 14.5% in the Cromford® Market Index for the 17 cities above. This is worse than the 13.4% decline we saw last week.
Well above average declines in CMI can be seen in Cave Creek, Buckeye, Chandler and Mesa. Falling but at a lower speed are Gilbert, Avondale, Maricopa and Tempe.
12 out of 17 cities are still sellers markets with Surprise in the balanced zone while Buckeye, Goodyear, Queen Creek and Maricopa are all buyers' markets. Buckeye has even slipped below the 80 level.
Oct 23 - Although most measurements of the housing market in Greater Phoenix have shown significant deterioration over the past month, this does not extend to prices
The monthly average sales price per sq. ft. has just breached $290 to the upside, while the average $/SF for listings under contract remains comfortably above $320.
As we see inventory rise we also see more sellers cutting their asking price, but this has not filtered through to the chart above.
Oct 21 - The chart below shows us quite how emphatically the housing market hates interest rates at 8%.

As recently as 3 weeks ago, we had just over 2 months of supply. Now we are headed over 3 months and we should all know that 3.5 to 4.5 months represents a balanced market. At the current rate of change we are only 2 weeks away from that range.
Calculating months of supply involves 2 numbers
1. The number of active listings (in this chart we have excluded those in UCB or CCBS status).
2. The monthly sales rate.
Item number one is now growing quickly after a long period of weakness.
Item number two is in a long term downtrend as demand continues to drop.
Both numbers are working together to push months of supply sharply higher
Oct 19 - Here is our latest table of Cromford® Market Index values for the single-family markets in the 17 largest cities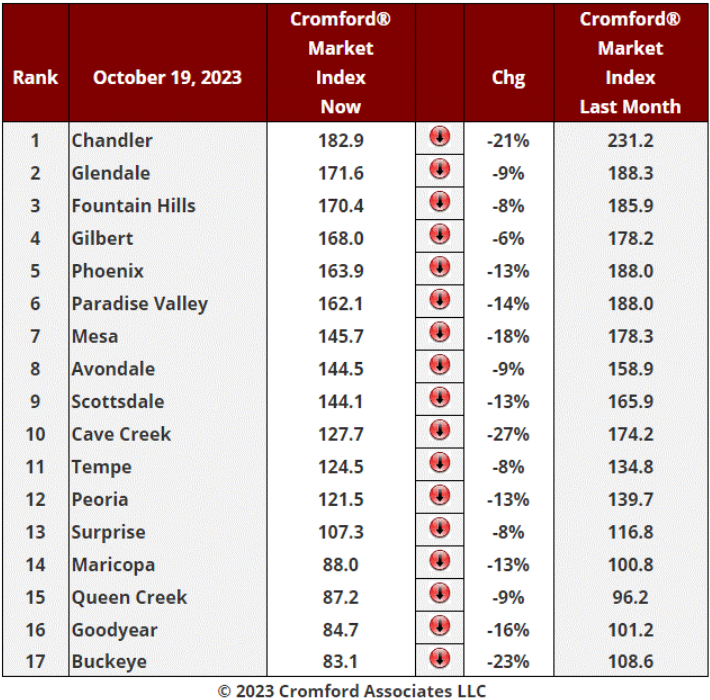
All 17 cities have seen their CMI drop over the last month, meaning that power is quickly slipping away from sellers and moving towards buyers. The average CMI in the table has fallen by 13.4%, well above the 11.2% we measured two weeks ago.
Although almost all pundits predicted rates would fall in the second half of 2023, the typical 30-year fixed mortgage rate is now around 8.03%, up from 7.33 a month ago. In historical terms, this is unexceptional, but the majority of home-buyers are too youmg to have experienced rates at this level before. Unless they are working with a seller who is prepared to buy-down their interest rate, the majority of buyers lack enthusiasm to jump in at this point and many are choosing to wait until times get easier. People would still like to buy a home eventually, so latent demand is rising while actual demand falls.
Supply is now rising at the fastest rate so far this year. The combination of lower demand and higher supply is just what sellers don't want.
Well above average declines in CMI can be seen in Chandler, Cave Creek, Buckeye and Mesa. Falling but at a lower speed are Gilbert, Avondale, Glendale, Queen Creek, Fountain Hills, Tempe and Surprise.
12 out of 17 cities are still sellers markets with Surprise in the balanced zone while Buckeye, Goodyear, Queen Creek and Maricopa are all confirmed as buyers' markets.
Oct 17 - The Cromford® Market Index managed to stay above 160 until August 19, but since then it has declined at an accelerating rate in the face of increasingly unattractive mortgage interest rates.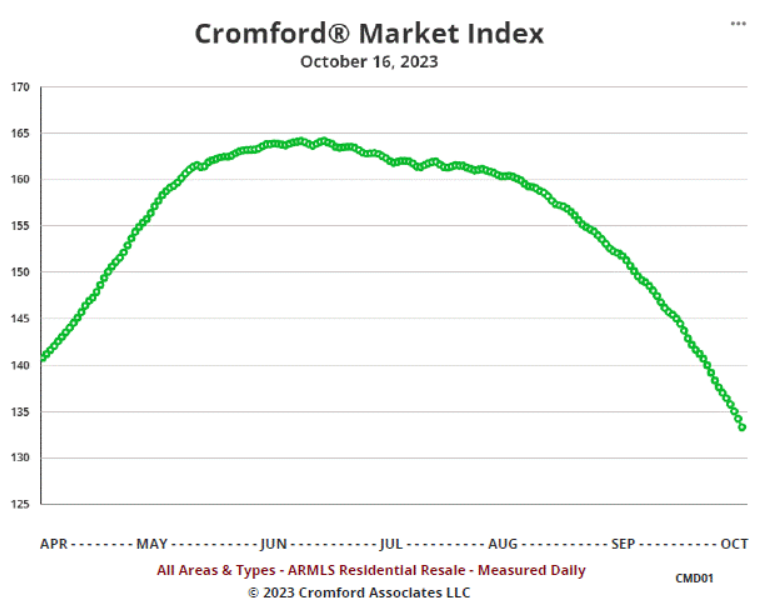
The 30-year jumbo rate has already breached 8% and the 30-year fixed rate looks likely to follow, after jumping higher at the start of this week. Demand has been weak all year but these rates are driving it to lower levels. At 73.2 the Cromford® Demand Index is the lowest we have recorded since January 11 and is still trending down. In January the Cromford® Supply Index was also heading down fast, keeping the market balanced in favor of sellers. This month we are seeing supply increase, so balance is shifting in favor of buyers.
Although we are not in the balanced CMI range between 90 and 110 yet, the current trend would place us there within a matter of weeks. This is not a reassuring situation for sellers and their confidence is much weaker than it was a couple of months ago. Buyers have a better negotiating position but those needing finance are increasingly dismayed at the cost of their monthly repayment. Both sides are unhappy, leading to weakening transaction volumes and lower closing rates. This spreads the hurt across all sectors of the housing industry. New home builders are the least affected, since they have the financial resources to buy-down the interest rates for their customers and so maintain better sales volumes and pricing.
The listing success rate has declined to around 76% after staying over 80% until the end of July. The positive news is that it has not dropped to the level of this time last year, when we seeing success rates in the low 60s.
Oct 8 - For much of this year, the new listing counts have been extremely low - often more than 40% below the same period in 2022. We saw somewhere between 6,500 and 7,500 new listings every 28 days between May 25 and Oct 2. Since Oct 3, we have been measuring slightly over 7,500 listings per 28 days. The normal level is 9,500 to 11,000. So we are still far below normal for the time of year, but not as far down as for the last 4 months.
The extra new listings are coming just as demand takes another leg down, which means the active listing pool is getting more input and less output. You would therefore expect the active listing count to grow, and you would be correct. For all areas & types we saw 13,901 active listings without a contract on Saturday, up 13,432 a week earlier and 13,103 the week before that.
With monthly and annual sales counts dropping, inventory measures such as months of supply and days of inventory are increasing. Though they are still below normal, the competition among sellers is growing and the buyers that remain have more choice. The market is softer than during the second and third quarters and upward pressure on prices is dissipating.
Oct 6 - Here is our latest table of Cromford® Market Index values for the single-family markets in the 17 largest cities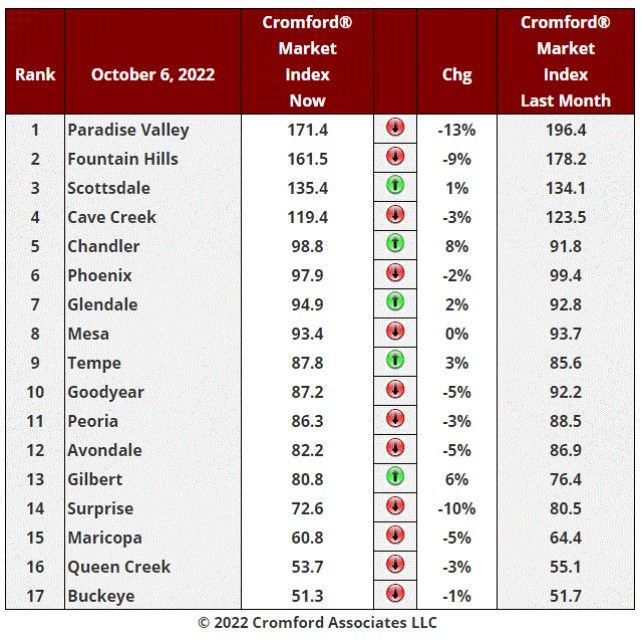
This is the most dismal table for sellers we have posted since November 10 last year. All 17 cities have seen their CMI drop over the last month, meaning that power is slipping away from sellers and moving towards buyers.
We do not have to look far to find the most obvious reason - mortgage interest rates. While most pundits predicted rates would fall in the second half of 2023, the shortage of buyers for bonds have caused yields to rise. The typical 30-year fixed mortgage rate is now around 7.7%, up from 7.3% a month ago. Understandably, buyers are far from enthusiastic about this and in some cases fail affordability tests they could once have passed easily.
This is not the whole story however, because supply is now rising at the fastest rate we have seen since last year. A combination of lower demand and higher supply means the average CMI in the table has fallen by 11.2%, well above the 9.4% drop we measured last week and 7.8% two weeks ago.
Well above average declines can be seen in Chandler, Goodyear, Buckeye, Maricopa and Mesa. Falling but at a much lower speed are Fountain Hills, Tempe and Surprise.
13 out of 17 cities are still sellers markets (for now) with Buckeye, Goodyear, Queen Creek and Maricopa in the balanced zone. However these 4 cities are now below the 100 mark implying that buyers have a slight edge in negotiations. On the current trajectory, these 4 could all be confirmed as buyers' markets before the end of the month.
Among the secondary cities, Laveen and Tolleson did manage small increases in their CMI, but the other 10 cities declined like their larger counterparts.
Oct 5 - The Affidavit of Value recorded during September by Maricopa County have now been analyzed and show us the following:
There were 5,896 closed transactions, down 18% from 7,174 in September 2022 and down 10% from August.
There were 1,624 closed new homes, up 1.6% from 1,599 in September 2022 and up 1% from August.
There were 4,272 closed re-sale transactions, down 23% from 5,575 in September 2022 and down 14% from August.
The overall median sales price in September was $450,000, down 2.8% from September 2022 and down 2.0% from August.
The re-sale median sales price was $440,000, down 1.1% from September 2022 and down the same percentage from August.
The new home median sales price was $479,102, down 7.4% from September 2022 and down 4.2% from August.
Because the market was already suffering from high interest rates in 4Q 2022, the year over year comparisons do not tell the full story of how much the housing market has contracted. The September 2021 closed transaction total was 11, 257, so last month was down a massive 48% compared with 2 years ago. New home sales have remained resilient and actually grew both month over month and year over year, despite the extremely weak demand in the re-sale market. If we look purely at re-sale closings September was down an incredible 55% compared with 2 years ago in September 2021. In contrast new home closings were down just 3% from 2 years ago.
Once again, the new home numbers were significantly affected by a large buy-to-rent transaction in Buckeye 85326 involving 173 new homes built by DR Horton and purchased by Progress Residential as rentals. This tranche of 173 single-family homes cost $56,206,719.67, meaning they cost only $324,894 each on average. Needless to say the new home median sales price would have been much higher if this transaction were to be excluded.
Oct 3 - The chart we showed on October 1 is somewhat depressing for agents working the re-sale housing market.
However below we have a much more cheerful version:

The key difference is that for this one we only included new home closings.
The dollar volume for new homes is not only higher than every prior year, it is up a massive 11.5% from last year. Clearly agents working for developers are not feeling the same challenges that the rest of the agent community is going through. Business is strong. demand remains good and there is no reluctance to sell due to cheap prior mortgages, because there are no cheap prior mortgages on newly built homes.
In addition, developers are happy to agree to use some of their gross margins to buy-down lower mortgage rates for their customers, at least for the first year or more.
Although the census has reported a sharp fall in building permits for single-family homes compared to a year ago, this trend has now reversed and more new homes are likely to become available in coming months.
Oct 1 - The dollar volume of closed transactions is shown in the chart below taken from the optional Cromford® Public section of our site.

This is for Maricopa and Pinal counties and we have filtered out all transactions except for Normal re-sales that went through the MLS. The numbers are year-to-date as of the end of August for each year.
The drop between 2022 and 2023 is 24%. If you are earning 24% less than last year then you are in-line with the market as a whole.
Even though sales volume is down massively, the increase in prices since 2020 means there is still more business (dollars) in 2023 than in 2020.
Sep 28 - Here is our latest table of Cromford® Market Index values for the single-family markets in the 17 largest cities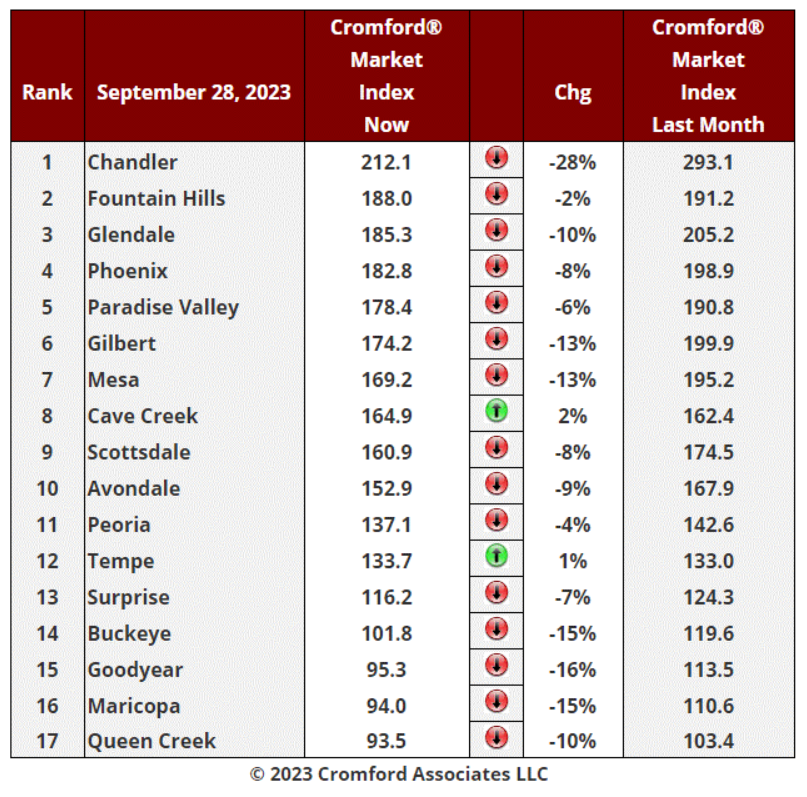
We still have 2 cities that moved in a direction favorable to sellers over the last month, Cave Creek and Tempe. However these 2 are only just positive and their change over the last 2 weeks is unfavorable for sellers. In any case ,these are two of the smallest of the 17 and the general direction of the market is swinging towards buyers. Supply is increasing and demand remains extremely weak.
We can also see that the market is becoming more favorable to buyers at an accelerating rate. The average CMI change in these 17 cities over the last month was -9.4%, more negative than last week when we measured -7.8%.
Most negative again this week is Chandler, down 28%, though it remains in first place. Goodyear, Maricopa, Buckeye, Mesa and Gilbert are also much weaker than this time last month, down at least 13%.
13 out of 17 cities are still sellers markets with Buckeye, Goodyear, Queen Creek and Maricopa in the balanced zone. However 3 of these cities are now below the 100 mark implying that buyers have a slight edge in negotiations in Goodyear, Maricopa and Queen Creek. On the current trajectory, these 3 could be buyers' markets by mid October, with Buckeye not far behind.
Supply remains well below normal in most areas, but Maricopa's supply index is now over 100, joining Casa Grande. Litchfield Park looks next to breach the 100 mark for its supply.
Supply is still extremely low in Anthem, Chandler, El Mirage and Gilbert.
Sep 26 - The latest S&P / Case-Shiller® Home Price Index® numbers were published this Tuesday.
The new report covers home sales during the period May to July 2023. This means the typical home sale closed in mid June, more than 3 months ago.
We are now seeing all 20 cities showing rising prices for the last few months, with a higher index for Phoenix for the fifth month in a row.
Comparing with the previous month's series we see the following changes:
1. Las Vegas +1.12%
2. Phoenix +0.88%
3. Cleveland +0.85%
4. Chicago +0.84%
5. New York +0.81%
6. Charlotte +0.76%
7. Miami +0.74%
8. Tampa +0.74%
9. Detroit +0.74%
10. San Diego +0.73%
11. Atlanta +0.70%
12. Los Angeles +0.62%
13. Washington +0.57%
14. Seattle +0.46%
15. Dallas +0.30%
16. Minneapolis +0.21%
17. Denver +0.18%
18. Boston +0.14%
19. San Francisco +0.14%
20. Portland -0.15%
Phoenix has risen very strongly in this table over the last 3 months, from last place In June to 16th place in July, 7th place in August and 2nd place in September. The national average increase month to month was +0.60%, so Phoenix was also comfortably ahead of that standard.
19 of the 20 cities are showing positive price appreciation month to month though the rates of appreciation are much lower than last month in the majority of them.
Comparing year over year, we see the following changes:
1. Chicago +4.4%
2. Cleveland +4.0%
3. New York +3.8%
4. Detroit +3.2%
5. Atlanta +2.2%
6. Washington +1.9%
7. Miami +1.9%
8. Charlotte +1.8%
9. Boston +1.3%
10. Minneapolis +1.0%
11. San Diego +0.7%
12. Los Angeles +0.4%
13. Tampa -0.8%
14. Denver -2.8%
15. Portland -3.3%
16. Dallas -3.4%
17. Seattle -5.5%
18. San Francisco -6.2%
19. Phoenix -6.6%
20. Las Vegas -7.2%
Phoenix lies in 19th place, down from 17th last month and among the weakest cities on a year over year basis. More than half the cities are now showing positive price movement from one year ago and once again the northern cities are looking good on the year over year measure.
The national average is +1.0% year over year.
Sep 23 - There are probably many subscribers who wonder why I am so dismissive of the usefulness of measuring days on market. I have no issue with measuring it for a specific listing, though you should always bear in mind that it may have been manipulated by the listing agent. But for the market as a whole, it is an unusually poor indicator. To see this let us look at the current weekly chart
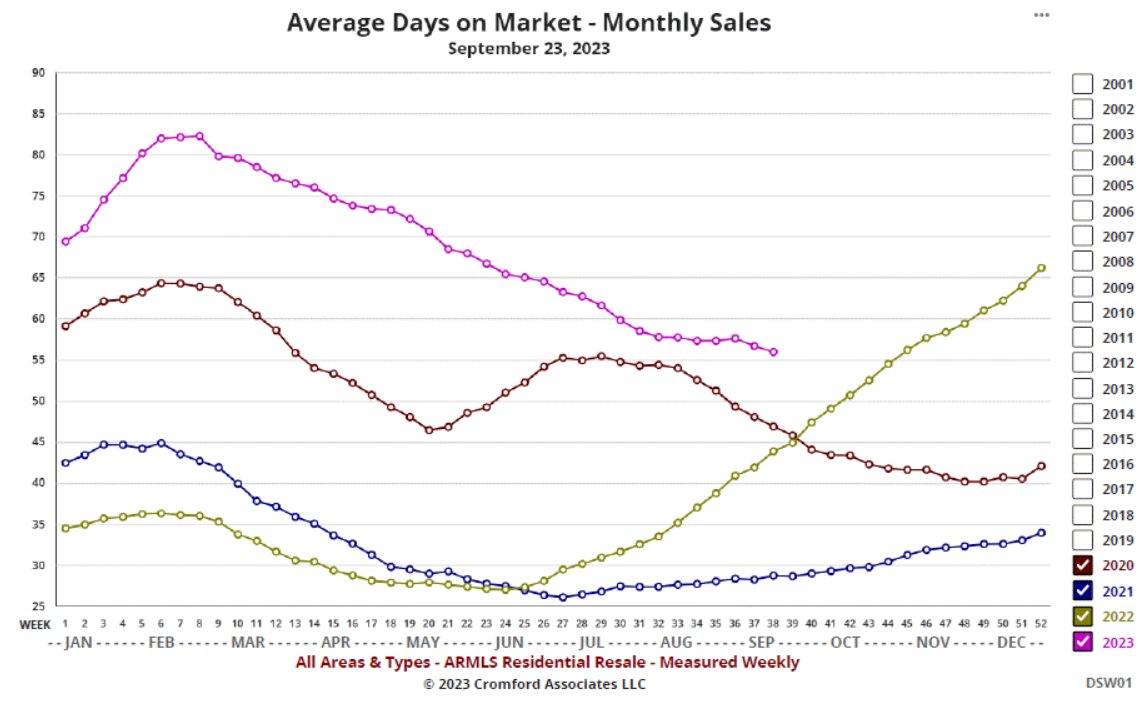
If you were basing your view on this chart, you would take away the impression that the market is improving for sellers and has been since February. This is not true. The market stopped improving back in June and is getting increasingly difficult as inventory starts to build and demand withers in the face of affordability pressures. Yet the average days on market for closed listings continues to fall.
Over the last 20 years, the average days on market can be seen to respond to market changes, but is is usually 2 to 4 months behind the times. This makes it worse than useless. It is positively misleading. We include the chart because so many people are familiar with the measure and want to know what it is. But we attach no credibility to any signals that it might send out. All the signals are out of date by the time they are received.
May 27 - If you are primarily focused on transaction volume, you will not like the housing market in 2023, because both supply and demand are well below normal. However, if you are looking at listing success rates, the market is performing very well, though not at the absurdly successful levels of 2021 and early 2022.
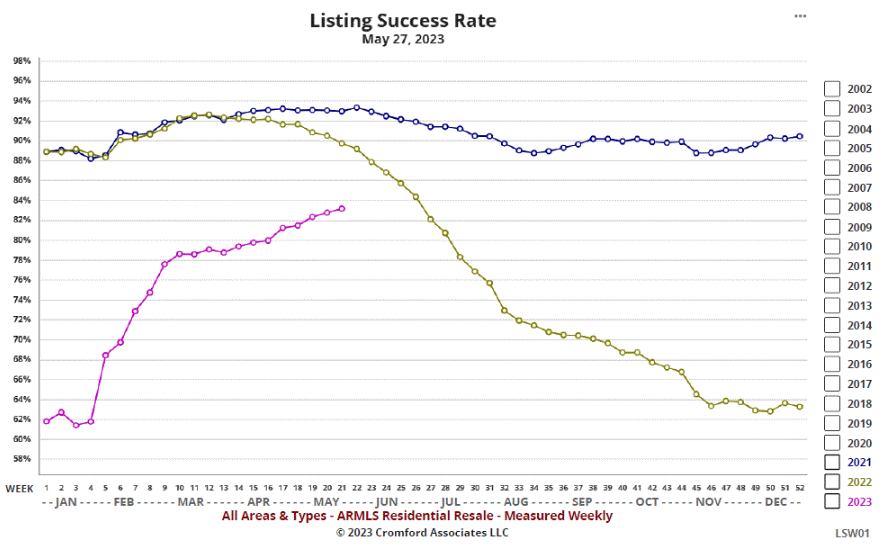
This means the few sellers we have are seeing their listings find buyers quite easily, with less than 17% getting cancelled or expiring.
The listing success rate has just moved above 83% for the first time since June 2022. The long-term average success rate is only 67.6% and rates over 83% are relatively uncommon in history. although they have become much more common since 2017. This is largely due to the chronic shortage of supply that still prevails today.
In fact we see rates over 83% only during the following intervals:
Feb - Jul 2005
Apr - May 2017
Mar - Aug 2018
Mar - Dec 2019
Feb - Apr 2020
May 2020 - Jun 2022
Those predicting home price declines should be reminded that listing success rates over 83% have been found to be incompatible with falling home prices.
May 25 - Here is our latest table of Cromford® Market Index values for the single-family markets in the 17 largest cities
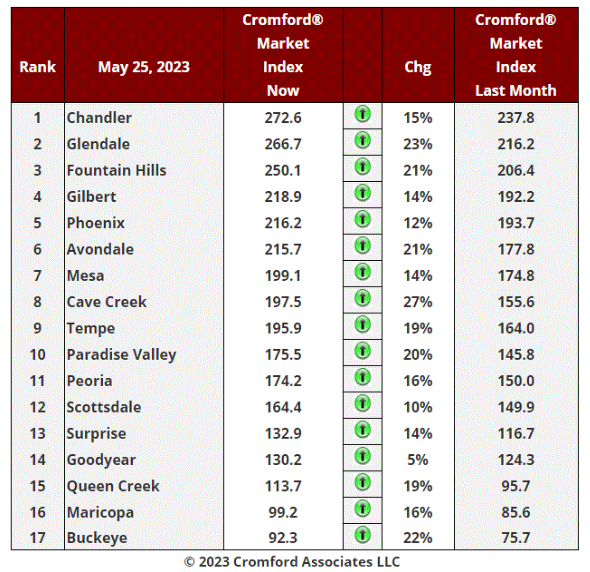
For the seventh week running, we have 17 of the 17 cities showing improvement for sellers over the past month. The improvement in the market for sellers has started to slow down, with the average CMI increasing 16.9% over the past month, down from 18.5% last week.
Most improved are Cave Creek (up 27%), Glendale (up 23%) and Buckeye (up 22%). Not far behind are Fountain Hills, Avondale and Paradise Valley. The slowest rate of improvement for sellers is 5%, achieved by Goodyear.
15 cities are in seller's markets, 2 are balanced and none is a buyer's market.
Demand remains weak and appears to be weakening a little in certain cities (e.g. Gilbert, Goodyear). However the demand remains substantially higher than supply in the majority of locations and so conditions are still working against buyers and in favor of sellers.
May 24 - We all know by know that low supply remains a big problem for the Greater Phoenix housing market. The most obvious source of improved supply would be the construction of new homes. However if you are focusing on the single-family home market, the news is bad. The chart below, extracted from the Cromford® Public section of our site, shows the year-to-date single-family permit counts between 1996 and 2023 for Maricopa and Pinal counties up to the end of April. The original chart provides data for all 15 counties, but we have filtered 13 of them out.

With only 6,550 permits issued year-to-date we are looking at a desperately low amount of new home construction, down almost 49% from last year and 2021. We have to go all they way back to 6,120 to find a lower year-to-date total.
With an unusually low number of re-sale homes coming to market, we can reasonably expect the supply shortage to last for a long time.
Those who predict more drops in sales prices will have to explain where a vast new supply is going to come from. Prices only drop when there is a glut of homes coming to market and not enough buyers. In the current circumstances this is looking very unlikely.
May 20 - Let's review where we stand on the pricing of closed listings, based on the monthly average price per square foot:
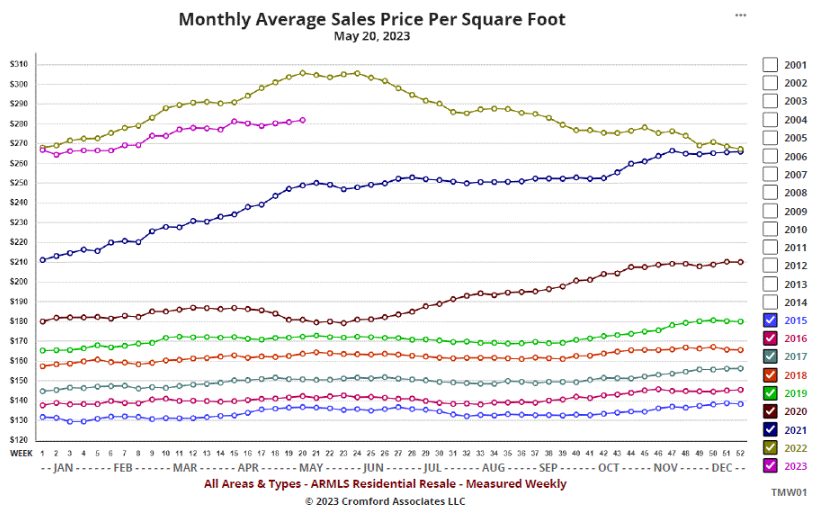
As you no doubt know, we like to measure this monthly average far more frequently than once a month, to avoid surprises. The chart above uses weekly measurements.
Prices remain far higher than they were before 2022, and have rising from below $267 in early January to above $281 in mid-May. The rate of increase over the past 4 months could be described as modest, but that would be a little unfair. A 6.6% rise between week 2 and week 20 is equivalent to an annual appreciation rate of 18%.
Do we expect this more-than-modest rate to continue? No. From May through September the weather in Central Arizona gets a little toasty but the housing market usually gets cooler, at least where average $/SF is concerned. You can see in the chart above how the average $/SF tends to go flat or even decline during this period in most years. The main exception was 2020, which was due to the sharp rebound after the initial COVID panic during the spring.
In most years with a healthy CMI, like 2023, we expect the majority of the upward price movements to occur between January and May and between October and December. Our tentative expectation is that prices will remain roughly flat (or dip slightly) from now until October and then rise again during the fourth quarter, as long as nothing dramatic occurs to change our assumptions.
This projection means that we expect to overtake the 2022 price line during September or October and finish the year well ahead of December 2022. It is unlikely that in 2023 we will exceed the peak of May/June 2022, which was fueled by over-excitement among the institutional buyers and iBuyers, but that event that is reasonably likely to occur during 2024.
All this assume conditions remain largely similar to today. The further out we look, the less we can rely on this assumption. Anything more than 2 months into the future should be taken as conjecture rather than a forecast.
May 19 - It is still easy to find people who believe there is a great wave of foreclosures coming onto the market in the not too distant future. These people are deluded by fabricated data that exists only in their own mind. All the real world data says that delinquency rates remain below normal, that pre-foreclosure activity is unusually low and that the rate of actual foreclosures taking place is extremely weak, even though most of the forbearance that was introduced during the pandemic has ceased.
According to Black Knight, the national delinquency rate fell five basis points from April to 2.75% in May, continuing the downward trend in overall delinquencies of the prior two months and marking yet another new low. To see a rise in foreclosures a year away you need to see a sharp rise in delinquencies happening today.
If you are thinking of making a career out of buying at foreclosure auctions (more correctly termed trustee sales), then you are going to be twiddling your thumbs with very little to do. I recommend you make different plans.
Today's pending foreclosure count for Maricopa County is just 993. For comparison, the count was 50,537 in September 2009. The average over the last 21 years is 10,156. Only a tiny fraction of pending foreclosures end up causing a real live trustee sale. The vast majority are cancelled. So if pending foreclosures are low, then actual trustee sales will be few and far between.
Simple math tells us that even if pending foreclosures increased tenfold from today, they would still be below average. No foreclosure apocalypse is in sight.
May 18 - Here is our latest table of Cromford® Market Index values for the single-family markets in the 17 largest cities

For the sixth week running, we have 17 of the 17 cities showing improvement for sellers over the past month. The improvement in the market for sellers continues to accelerating, with the average CMI increasing 18.5% over the past month, up from 17.8% last week.
Most improved are Paradise Valley (up 30%), Cave Creek (up 29%) and Tempe (up 29%). Not far behind are Buckeye, Glendale and Avondale. The slowest rate of improvement for sellers is 9%, achieved by Goodyear and Scottsdale and still a substantial positive trend.
Improvements for sellers are relatively modest in Surprise, Chandler and Scottsdale.
15 cities are in seller's markets, 2 are balanced and none is a buyer's market.
Despite the continued low sales volume, demand is much higher than the unusually weak supply in the majority of locations.
May 17 - It is not just Central Arizona that is struggling with a low supply of homes for sale. The situation is also severe in many areas of the USA. In parts of California the inventory level is approaching the lowest level ever seen, in January 2022.
This will drive remaining buyers into the arms of the new home builders. It is no wonder that the home builders are feeling pretty pleased with themselves. Re-sale homes are their primary competition and when re-sale supply is weak, they are in a strong position.
May 13 - The months of supply reading for all areas and types is currently 1.6. There have been only 3 years since 2005 where months supply in mid-May was lower than this. These were 2012, 2021 and 2022. With only 1.6 months of supply, many buyers are having to compete with each other despite the weak demand. This is especially true of those trying to buy in the well-established and more central areas. In a balanced market we would expect to see 3 to 4 months of supply, while 6 months or more is seen in a market that is heading for decline.
Sara Waide Bowers, a long-time subscriber to the Cromford Report, recently wrote to tell me "Some of the crazy is coming back. I recently wrote an offer $25,000 over list and my clients were beaten out by other offers 'with more attractive terms' on a home that needed flooring and paint throughout, new AC units and had evidence of water intrusion around the windows and roof leaks". This was in the 85248 zip code in Chandler.
She added "I also had another agent saying how she didn’t want the insanity to start again, but would we waive inspections to beat the competing offer. Another home needing significant work. We also came in over list on that offer. Clean, no concessions, no home warranty".
With sellers receiving multiple offers their will be fewer of them feeling pressure to be generous with concessions or agreeing to buy down the buyer's mortgage rate.
Many buyers will be surprised to find they have much less leverage than they expected in this so called "weak market". Buyer's agents will have to do a lot of explaining to get them to understand the true nature of today's market, especially if they have been watching YouTube videos by inexperienced and alarmist commentators. These are often so far removed from reality that they rival the flat-earth proponents.
There are many crazies on YouTube that seem to get far more views and subscribers than the sensible commentators. If you need an effective antidote to the crazy stuff, I can recommend Jon Schwartz's YouTube channel. He only has just over 3,000 subscribers, but he should be commended for dealing in balanced facts and realism. Most of the others I have seen on YouTube are trying to boost subscriber counts by constantly spreading easily disproven falsehoods, laced with dire warnings that simply spread alarm and have no factual justification. Unfortunately human nature means that the crazies get most of the attention which is rewarded by YouTube monetarily. I suspect these commentators may not even believe the rubbish they present. But they are probably laughing all the way to the bank at the gullibility of their subscribers.
May 12 - Here is our latest table of Cromford® Market Index values for the single-family markets in the 17 largest cities
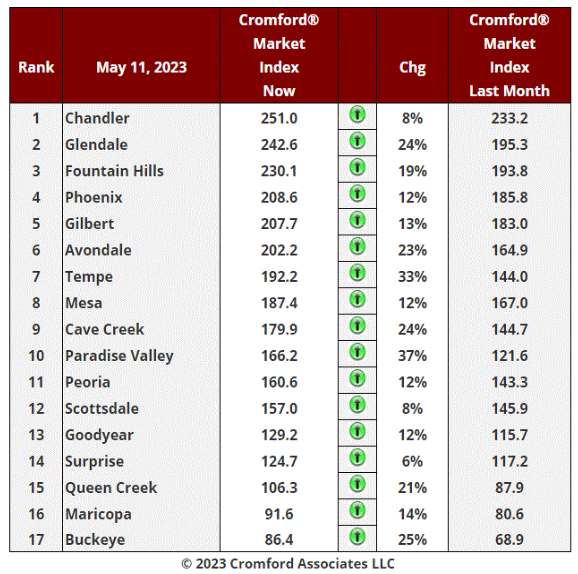
For the fifth week running, we have 17 of the 17 cities showing improvement for sellers over the past month. The improvement in the market for sellers is really accelerating now, with the average CMI increasing 17.8% over the past month, up from 16.1% last week.
Most improved are Paradise Valley (up 37%) and Temp (up 33%). Not far behind are Buckeye, Cave Creek, Glendale, Avondale and Queen Creek.
Improvements for sellers are relatively modest in Surprise, Chandler and Scottsdale.
We now have 6 cities over 200, meaning that multiple bid situations will getting more commonplace.
14 cities are in seller's markets, 2 are balanced and only 1 is a weak buyer's market. Buckeye look like it will only be a buyer's market for a few more days.
To find a location that is still strongly favorable to buyers, we need to look at the secondary cities. There we find Casa Grande. The CMI in Casa Grande is low (71.8) and is still dropping, albeit slowly. It is by far the weakest market in Central Arizona.
May 11 - The iBuyers have cleaned out their excessive inventory and are back to relatively normal operation. The chart below shows OfferPad listing counts on ARMLS:
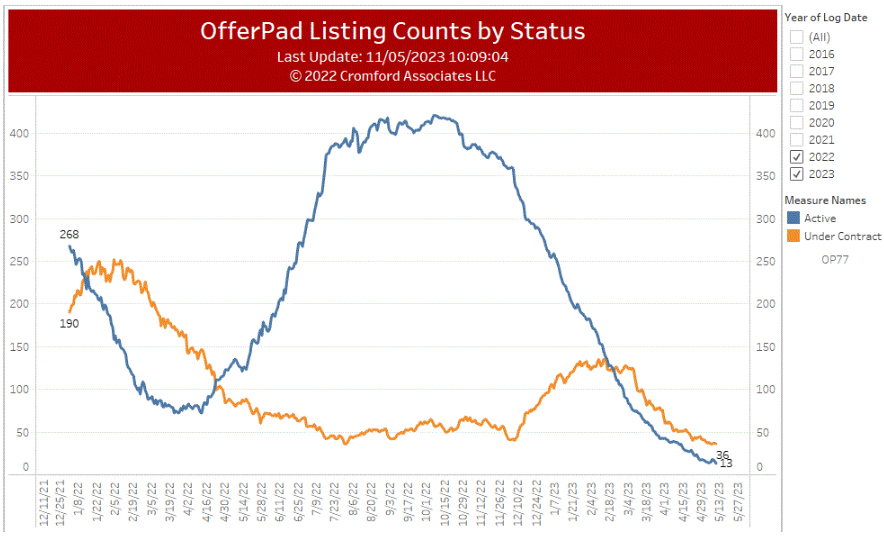
What stands out is the huge bulge of excessive homes that they bought at high prices during Q2 of 2022. With over 400 active listings and only 50 or so under contract, they clearly had a severe problem. Having focused almost all their efforts on iSelling rather than iBuying during the past 12 months they have worked the active count down by almost 97%. At 36 to 13 the ratio of under contract to active listings is now healthy again. However they have lost a huge amount of market share during this process and in most respects are a much smaller company than they were at the start of 2022. This is also reflected in their stock price which has declined 87% from over $5 to around 50 cents today.
But it must feel a lot better to have that inventory problem in the rear view mirror rather in front of them.
May 8 - With both buyers and sellers lacking enthusiasm, closing volumes remain weak compared to normal and especially to last year. This is causing the annual sales count to decline. It is now approaching the 75,000 level, having exceeded 95,000 in October.

The peak was in mid-2021 when we saw over 115,000 listings closing per year.
At some point the annual sales rate will reach a bottom and start to climb again. It is not yet clear when this will occur.
May 6 - The media have been full of stories for the last six months about the shortage of home buyers. They have devoted very little coverage to the shortage of home sellers over the same period, which is in fact far more extreme and is having a bigger effect on the market.
Between April and October last year we had plenty of sellers because those who saw their properties as investments were keen to avoid the risk of a major drop in value. Those were joined by the iBuyers who realized too late that they had purchased far too many homes for the market conditions since April. This caused a short-term stampede for the exits. But from a longer-term perspective this was of little significance.
In any case, this all started to reverse in November and we now have a real problem getting enough homes listed on the MLS. If your home has an existing mortgage, the odds are high that it has a much lower interest rate than anything available today. So unless you really have to move, it makes more financial sense to stay put and avoid redeeming that bargain mortgage only to replace it with a much more expensive one. Many are choosing to upgrade or expand their home in situ instead.
There have been 33,506 new listings added so far in 2023. At the same point in 2022 we had 42,048. In 2021 there were 41,210 and in 2020 40,744. To be down more than 20% from the prior year is very unusual and the flow of new listings is too low to compensate for the listings going under contract. This means the active listing count has been in decline for over six months now and is still trending down at a steep angle.
The total active count, excluding UCB and CCBS listings, has dropped from a peak of 19,679 across Greater Phoenix to 11,298 today. This fall of almost 43% has transformed the negotiating balance between buyers and sellers. 19,679 wasn't even a high number, with 25,000 to 30,000 representing normal market conditions.
By price range, for the single-family segment we see since November 1:
homes listed under $225,000 are down 52%
homes listed between $225,000 and $275,000 are down 64%
homes listed between $275,000 and $350,000 are down 47%
homes listed between $350,000 and $500,000 are down 55%
homes listed between $500,000 and $600,000 are down 47%
homes listed between $600,000 and $800,000 are down 38%
homes listed between $800,000 and $1 million are down 35%
homes listed between $1 million and $1.5 million are down 33%
homes listed between $1.5 million and $2 million are down 18%
homes listed between $2 million and $3 million are up 9%
homes listed over $3 million are up 14%
The drop in available supply is most severe in the price ranges below $600,000. It is only slightly better between $600,000 and $1.5 million. Once you reach $2 million we have no real shortage - there is more choice available today than at the beginning of November. However demand has held up quite well at these higher price ranges.
We hear that some people are choosing to rent because they think that home prices are likely to come down. This is not at all likely in the face of a supply shortage like we are experiencing. Wanting something to happen does not make it happen.
May 4 - Here is our latest table of Cromford® Market Index values for the single-family markets in the 17 largest cities
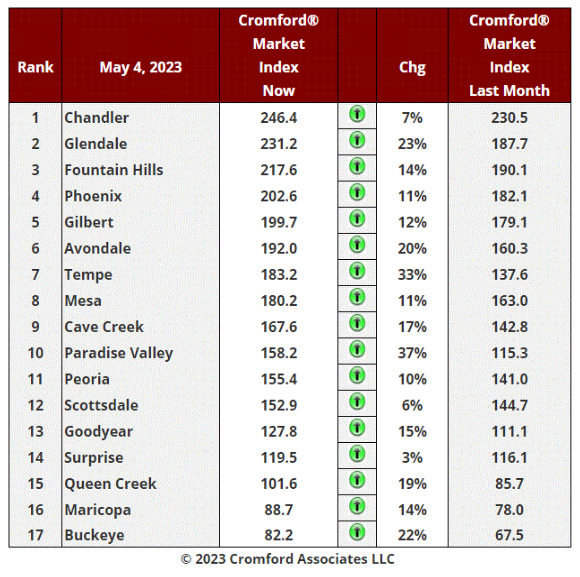
For the fourth week running, we have 17 of the 17 cities showing improvement for sellers over the past month. The improvement in the market for sellers is really accelerating now, with the average CMI increasing 16.1% over the past month, up from 14.3% last week.
New supply is unusually weak and nowhere near enough to replenish stock, even though demand is well below average. Demand is no longer in decline and has started to grow in most areas..
Paradise Valley has turned around dramatically and is now rising the fastest of all 17 cities. Tempe is looking very strong, while Glendale, Avondale and Buckeye have all risen by 20% or more over the last month.
The slowest improvements are once again in Surprise, Scottsdale and Chandler. Chandler looks threatened by Glendale for the top of the table.
We now have 4 cities over 200. This market is more imbalanced than most people appreciate. Low demand and very low supply are not everyone's idea of a hot market, but this level of imbalance is more than enough to create price appreciation.
Like last week, we have 14 cities in seller's markets, 1 is balanced and 2 in buyer's markets. Maricopa and Buckeye look like they will only be buyer's markets for a few more days.
Queen Creek will probably become a seller's market within a couple of weeks, as demand is looking quite strong there.
May 2 - The Maricopa County affidavits of value have been counted and show us the following numbers for April 2023:
There were 6,840 closed transactions with a median sales price of $454,945
Closings were down 34.5% from April 2022, and down 13.2% from March 2023
The median sales price was down 5.1% from a year ago but up 1.8% from last month
The median sales price has risen three months in a row and is now up 3.4% from the low point of January 2023.
New home sales totaled 1,423 with a median sales price of $513,227
The new home sales count was up 10.3% from April 2022 but down 16.2% from March 2023.
The new home median sales price is up 3.4% from a year ago, and up 1.1% from last month
The re-sale transaction count was 5,417 with a median sales price of $435,000.
The re-sale count was down 41% from April 2022 and down 12.4% from March 2023.
The re-sale median sales price was down 8.4% from last year but up 1.4% from last month
Closing counts were weak in April, opening up a wider gap with 2022 than we saw last month. This is particularly true of re-sale closings, down 41% from last year, while new home sales were up an impressive 10% compared to 2022.
Pricing looks surprisingly positive however, with the medians rising across the board over the last 3 months. New homes are leading in this area with a 3.4% rise in their median sales price over the past 12 months, while re-sales are showing an 8.4% drop over the same time-frame. Of course, these numbers do not show any below-the-line incentives offered by the seller. These are likely to be higher in April 2023 than they were this time last year.
Apr 30 - There were 25 residential foreclosures in April 2023.
This is the lowest number since September 2022. It is a tiny fraction of the 200 or so we typically saw per month in 2017 and 2018, and an even smaller fraction of the 3,000 to 4,000 per month we experienced between 2008 and 2011.
Lender REO inventory remains close to an all-time low at 160 to 180, currently 169.
Some people, disconnected from reality, still claim there is a wave of foreclosures building. There is no evidence whatsoever to support that position.
Apr 29 - The US Census Bureau has provided us with the building permit counts for March 2023 and we can see some recovery in single-family building plans. For Maricopa and Pinal counties, developers scaled back their planning for new homes starting in June 2022 and reached a low of just 997 in December. January and February were little better, but March has seen a jump back to 2,216. This is still well below the 3,000 level we were seeing regularly in 2021 and early 2022, but it suggests the trend has reversed.
Home builders are clearly feeling in an optimistic mood, which is not surprising.
In the multi-family segment, expansive building plans are still accelerating. There were 3,143 housing units granted planning permission in March across Maricopa and Pinal. This is the second highest monthly total ever seen and includes 2,046 in Phoenix, the city's highest total ever.
Apr 27 - Here is our latest table of Cromford® Market Index values for the single-family markets in the 17 largest cities
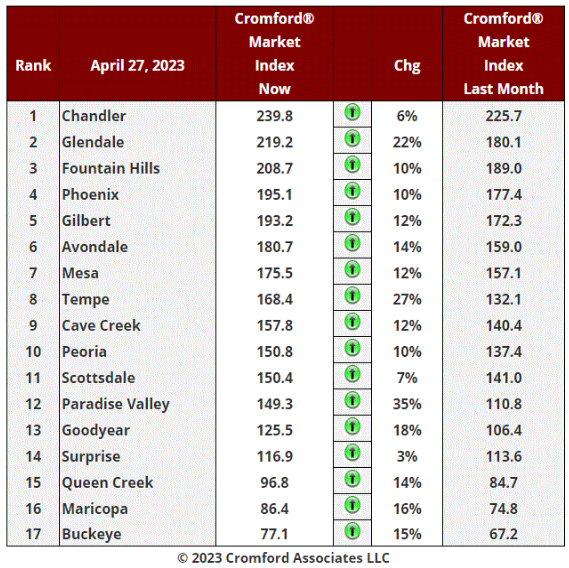
For the third week running, we have 17 of the 17 cities showing improvement for sellers over the past month. The average CMI is up 14.3% over the last month. The improvement is clearly accelerating again, having been 11.4% last week. Supply continues to fall while demand is now rising again.
Paradise Valley has turned around sharply and is now rising the fastest. Tempe and Glendale are also looking very strong.
The slowest improvements are now in Surprise, Scottsdale and Chandler.
We have 14 cities in seller's markets, 1 is balanced and 2 in buyer's markets.
Apr 25 - The latest S&P / Case-Shiller® Home Price Index® numbers were published today.
The new report covers home sales during the period December 2022 to February 2023. This means the typical home sale closed in mid January. We should remember that this makes the Case-Shiller Index just over 3 months out-of-date on the day it is published and just over 4 months out of date before the next report is issued. This means the Case-Shiller Index can only tell you about the distant past, not what the market is doing now. It is close to useless for measuring the present situation in the market and completely useless for forecasting purposes. Because it is so widely reported and followed, these facts are often forgotten.
We are just now seeing the first signs of the turn-around in the market reflected in the Case-Shiller Index, with a slightly higher index for Phoenix compared with the previous month. In the Cromford® Report we have been measuring and reporting on the same turnaround for more than 3 months now.
Comparing with the previous month's series we see the following changes:
1. San Diego +1.5%
2. San Francisco +1.0%
3. Los Angeles +1.0%
4. Denver +0.8%
5. Washington +0.4%
6. Atlanta +0.4%
7. Chicago +0.3%
8. Phoenix +0.1%
9. Boston +0.1%
10. Tampa +0.1%
11. Charlotte +0.0%
12. Cleveland +0.0%
13. Dallas -0.0%
14. Minneapolis -0.1%
15. Portland -0.1%
16. Detroit -0.2%
17. New York -0.3%
18. Seattle -0.3%
19. Miami -0.4%
20. Las Vegas -0.9%
Phoenix has risen from 17th to 8th place but is still below the national average, which was +0.2%.
The change from last month is dramatic. 12 of the 20 cities are showing positive price appreciation month to month. There was only 1 last month.
Miami has plunged from first place to second from bottom.
Comparing year over year, we see the following changes:
1. Miami +10.8%
2. Tampa +7.7%
3. Atlanta +6.6%
4. Charlotte +6.0%
5. Cleveland +3.9%
6. Chicago +3.6%
7. New York +3.6%
8. Boston +2.2%
9. Dallas +2.0%
10. Detroit +1.6%
11. Washington +1.1%
12. Minneapolis +0.5%
13. Denver -1.2%
14. Los Angeles -1.3%
15. Phoenix -2.1%
16. Las Vegas -2.6%
17. Portland -3.2%
18. San Diego -4.2%
19. Seattle -9.3%
20. San Francisco -10.0%
The national average was +2.0%. Phoenix moved up one place from last month.
Apr 22 - So many market indicators have improved over the last month that it is hard to know where to start. Here is the concise snapshot for today:
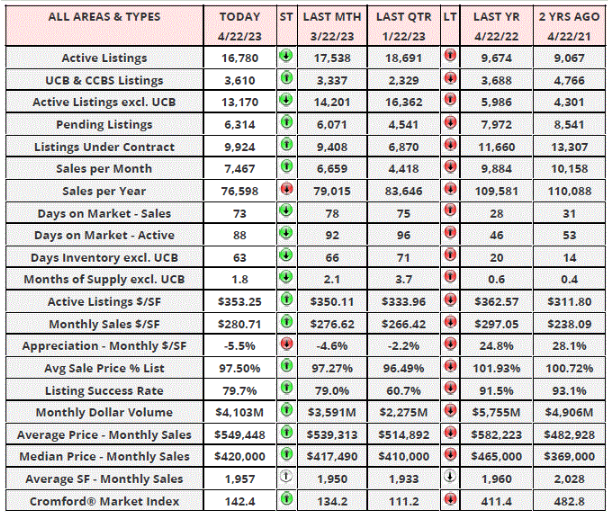
Obviously everything looks unfavorable for sellers compared to April last year, but almost everything is looking favorable compared to last month. There are two exceptions - the annual sales rate and the annual appreciation rate based on the monthly average $/SF. These will take a long time to turn around, by their very nature.
Compared to March 22, we see:
available supply is significantly lower
listings under contract are higher
sales are up sharply, but still low by normal standards
dollar volume is up
days on market are coming down
average and median pricing is up
listing success rate is up
homes are closing at a higher percentage of their final list price
the CMI is up
Since all the indicators are showing the market improving for sellers, it is safe to throw out the skepticism and move on to relief. We have a full-on recovery taking place.
Apr 20 - Here is our latest table of Cromford® Market Index values for the single-family markets in the 17 largest cities
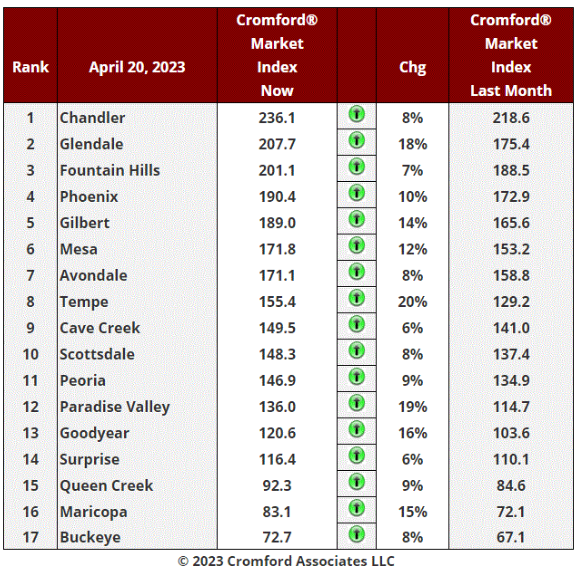
Once again we have 17 of the 17 cities showing improvement for sellers over the past month with all these areas witnessing a strengthening market. The average CMI is up 11.4% over the last month. The improvement is accelerating once again, having been 10.0% last week. This is due to an increase in the number of listings going under contract and falling supply counts.
The positive trend is spreading widely now with even the slowest improving areas (Surprise, Cave Creek) showing a 6% increase. Tempe is improving fastest at 20% with Paradise Valley, Glendale and Goodyear just behind at 16% to 19%. Queen Creek is now a balanced market (over 90) and Maricopa is heading in that direction. Buckeye remains a buyer's market and has some ground to make up.
There are still plenty of people who believe the market "should" be crashing, but the market is not taking any notice of this foolishness.
Things are even more positive when we look strictly at the new home market. Pricing has remained stronger than the re-sale market and builders are having little trouble selling all the homes they can complete. Gross margins are strong and leave room for incentives to close the deal.
Home builders may have more difficulty getting financed after recent bank failures have tightened up commercial lending. This will favor the larger public builders who are sitting on balance sheets with large piles of cash and have fixed interest loans that seem very cheap by today's standards. We anticipate this will mean the large developers will probably grow their market share at the expense of the smaller builders. Wall Street seems to agree, with home builder's stocks moving strongly higher over the past 3 months.
Apr 18 - Having forecast yesterday that the listings under contract count would exceed 10,000 this week, the market obliged by delivering a very robust increase of 338 today.
This means we have a monthly increase of 14%, almost unheard of for the time of year.
Demand is starting to heat up a bit. Supply, meanwhile, is dropping sharply. Down 363 listings from yesterday.
Apr 17 - Demand is beginning to improve. as we can see from the chart below:
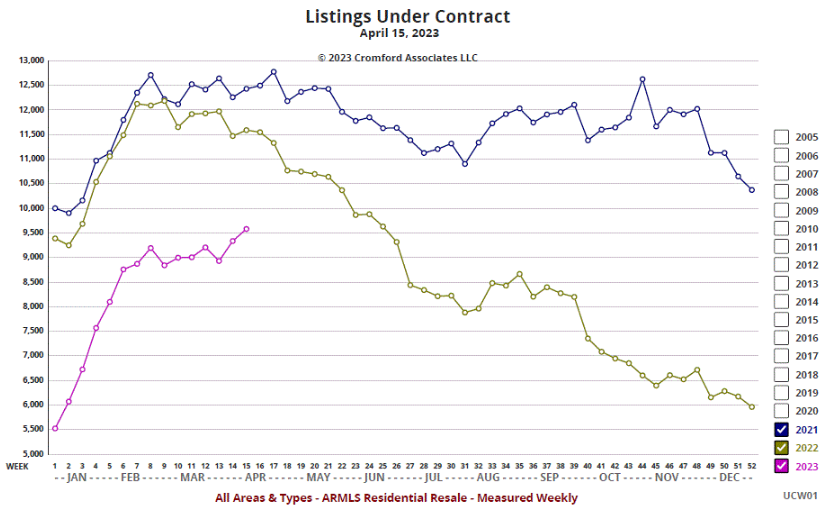
The listings under contract count is making a determined attempt to breach the 10,000 level. In the 2 days since we created this weekly chart the count has reached 9,944, meaning it is quite likely that target will be exceeded later this week.
That puts us ahead of where we were in late May last year.
The Cromford® Demand Index has started to stabilize and confidence appears to be slowly improving.
Apr 15 - In examining the table of cities ranked by annual average $/SF, I noticed the following:
top performers for appreciation were 3 of the most expensive cities (Paradise Valley, Carefree and Fountain Hills) plus the least expensive (Coolidge).
lowest performers were Arizona City and Eloy
55+ areas are towards the bottom of the pack for annual appreciation (Sun City, Sun Lakes, Sun City West).
New River and Scottsdale were well above average.
Wickenburg, Cave Creek and Youngtown were also above average.
Despite the correction in the second half of 2022, the annual average $/SF is still well above the annual average on April 13, 2022, for every part of Central Arizona. The same is not true when we look at the monthly average $/SF. However that is often a very volatile measure, especially for smaller cities and towns. It makes little sense to measure the monthly average for cities the size of Paradise Valley, as the sample size of a month of sales is far too small for statistical reliability. It is fine for Phoenix, Mesa or Scottsdale, but the usefulness of the monthly average declines sharply as the number of sales per month drops.
Apr 13 - Here is our latest table of Cromford® Market Index values for the single-family markets in the 17 largest cities

We now have 17 of the 17 cities showing improvement for sellers over the past month with Paradise Valley finding its mojo again. The average CMI is up 10.0% over the last month. The improvement is accelerating slightly, having been 9.7% last week.
The positive trend is spreading widely now, but the intensity has dropped since nowhere is it showing a monthly CMI increase of 20% or more. Maricopa is improving fastest at 17% with Goodyear, Gilbert and Glendale just behind at 16%. Queen Creek will be a balanced market (over 90) in a matter of days with Maricopa closing the gap quickly. Only Buckeye remains a strong location for buyers to flex their muscles and even here the trend is working against them.
If all the indicators are showing green, then why are so many real estate agents unhappy? That's because we have so few people wanting to buy a home. The reason the table above is positive is that we have even fewer people wanting to sell a home. Motivation to sell is extremely low. There are more people who want to buy than sell - that indicates prices will rise. But the lack of sellers and buyers is bad news for industry professionals who like to see high volumes of both.
The media and many analysts seem to focus on demand, which is obviously poor, so they come up with gloomy forecasts, wrongly. They forget that it takes two to tango. Demand means very little unless it measured against supply. Supply is unusually weak except at the top end of the market - the number of new listings continues to drift lower from already low levels. The unimpressive demand is more than enough to soak up all the new supply and more. Buyers have less to choose from and although they are few in number they are now competing for a dwindling stock of homes for sale. Times are getting tougher for buyers.
In this environment estate agents are not busy enough, but prices have nowhere to go but up. The investors and iBuyers with strong motivation to sell were frantic in the second half of 2022, causing prices to tumble, but that is old news.
Average sale $/SF is already up 5% in 2023 and we are only in mid-April.
Apr 10 - Taking a look at the monthly average sales price per square foot, we see this in the daily chart:
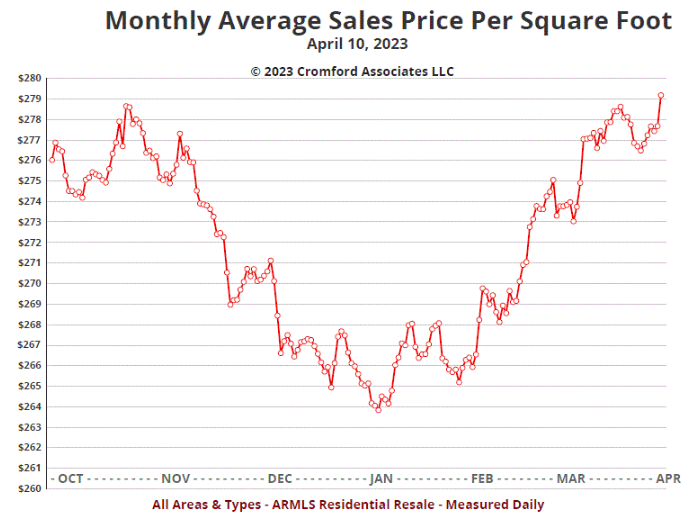
The latest average is over $279 meaning the highest pricing during the last 6 months was recorded today.
I would like to refer to our observation of Sep 25, 2022 where we claimed that we were NOT in a crash and that our advice was to keep calm and carry on. We had plenty of people tell us they disagreed and that it was a great time to panic. The average $/SF is now back to where it was in late September, so we believe our advice was sound and our observation accurate.
Although the dip between November and January was a bit scary, the recovery in price has been equally strong since then.
Volume is well below normal, with both sellers and buyers lacking enthusiasm, but prices are buoyant and in even better shape then we expected. With the Cromford® Market Index still moving higher, our expectation is that prices will edge higher still in the next few months. I would not have strong expectations for the third quarter because we almost always see a 3Q dip in every year. This is due to the seasonal effect on the luxury market. Unless we get an unexpected source of new supply, the fourth quarter should show a rebound from that dip, meaning that annual appreciation will have turned positive again by November.
Volume will take time to recover while skepticism remains dominant. The next stages of hope, followed by relief should not be far away, since all the market number we see are improving
Apr 9 - Here is the weekly chart for months of supply, excluding UCB and CCBS listings:
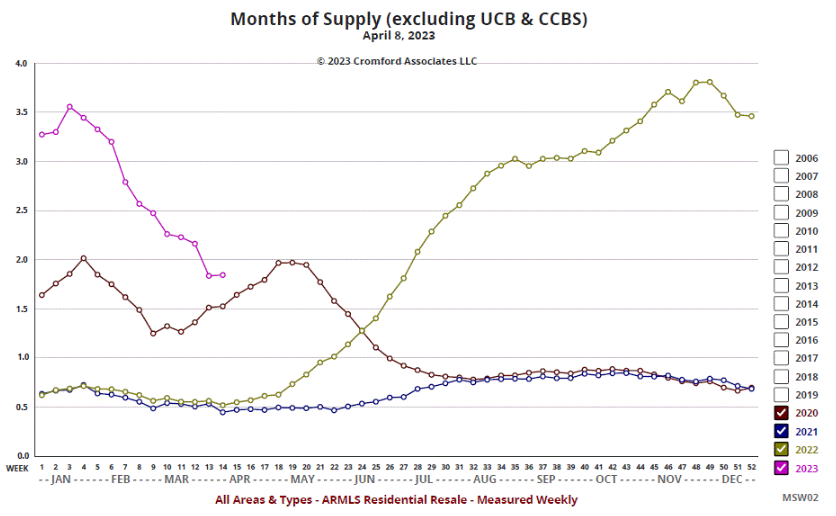
We have well below 2 months of supply, consistent with a seller's market and less than half the 3.8 months we saw at the end of last November.
If you have clients who think prices are going to fall further, ask them to explain where the new supply is going to come from that would cause that to happen. Prices are unlikely to fall unless supply rises to more than 3 months. Foreclosures remain very scarce and single-family home builders have dropped their production plans sharply, driven by an abundance of caution. With prices for new homes holding up well, they will probably regret that caution over the next several months.
Perhaps owners of short-term rentals will tire of that business, now that occupancy rates are well down from a year ago. Many owners were disappointed with their receipts from the Super Bowl. We seem to have an excess of short-term rental supply which means owners are having to compete with each other on price for short-term tenants. As we head into the low season for holiday rentals, we may see some get sold off. More likely they will be converted to long-term rentals, where the rental prices are much lower but the percentage occupancy is likely to be much higher. Demand for long-term rentals is generally more reliable and consistent.
If I owned a short-term rental property with disappointing occupancy rates (I don't), I would wait for higher prices before considering selling. So conversion to a long-term rental would be my first step.
Apr 6 - Here is our latest table of Cromford® Market Index values for the single-family markets in the 17 largest cities

The market continues to improve for sellers with the average CMI up 9.7% over the last month. The improvement has started accelerating again, having been 9.0% last week.
Only one city, Paradise Valley, saw a decline in its CMI over the past month, but Paradise Valley has also started to improve for sellers over the past 2 weeks, with a significant and sudden rise in demand.
The positive trend is more widespread now, but not quite so intense, with only Gilbert showing a monthly CMI increase of 20% or more. However the pace of improvement is still impressive given the affordability constraints we are facing. Chandler, Maricopa, Goodyear, Peoria, Glendale, Phoenix, Mesa, Surprise and Scottsdale have all risen by 12% or more over the past month.
We have 14 cities that are seller's market, 0 balanced and 3 buyer's markets.
It is clear that, in contrast to the COVID years, more remote locations are easier to buy than more central ones. Competition among buyers is getting stiff in the most affordable central locations and supply is quickly dropping to extremely low levels. Examples include El Mirage, Tolleson,
Upward pressure on pricing is starting to build. Bargains are getting harder to find and are mostly confined to the outer areas such as Casa Grande, Buckeye and San Tan Valley.
The general public appears to underestimate how quickly the housing market is recovering from the brief correction of 2022. Buyers need to come to terms with this or they will be left in the dust.
Apr 4 - The Maricopa County affidavits of value have been counted and show us the following numbers for March 2023:
There were 7,880 closed transactions with a median sales price of $446,750
Closings were down 30.8% from March 2022, but up 33% from February 2023
The median sales price was down 4.9% from a year ago but up 1.5% from last month
The median sales price has risen two months in a row
New home sales totaled 1,699 with a median sales price of $507,664
The new home sales count was up 9.1% from March 2022 and up 40.6% from February 2023.
The new home median sales price is up 2.1% from a year ago, but down 1.4% from last month
The re-sale transaction count was 6,181 with a median sales price of $429,000.
The re-sale count was down 37% from March 2022 but up 31% from February 2023.
The re-sale median sales price was down 7.7% from last year but up 2.1% from last month
This is a recovering market with new homes leading the way. In fact they are a long way in front of the re-sale market with the monthly closings at their highest level since December 2021 and higher prices than this time last year.
Since the majority of new homes are not listed in the ARMLS database, the overall market is doing better than the ARMLS numbers tell us. Overall pricing is well down from the peak of $490,000 reached in May 2023, but has rebounded from its low point of $439,900 in January 2023.
What we have witnessed over the past 12 months is not a crash, but a normal correction taking out the over-exuberance, especially the abnormal demand from over-optimistic iBuyers and institutional investors. Market dynamics remain surprisingly healthy after this short correction and with tight inventory still declining, we are likely to see prices continue to rise going forward. This will not please the Federal Reserve who would clearly like to see lower pricing in both home sales and rents.
Investor purchases were 13.7% of the total, which is the lowest share since December 2020.
Momentum has evaporated from rental prices but they remain around $1.30 to $1.35 per square foot per month. This is 30% to 35% higher than they were in early 2020.
Apr 1 - Since this time last year, the iBuyers have suffered a lot of pain as they struggled to cope in a market with declining prices. We thought we should take stock of what has happened between then and now. The Fix & Flip and iBuyer charts in the optional Cromford® Public section of the site give us the data on which to base our analysis.
We will focus here on Opendoor, by far the largest of the iBuyers by transaction count. They went through a difficult period between October 2021 and December 2021 when they made a median gross profit per house of close to zero. This was at the same time as Zillow was losing $30,000 to $40,000 on each home sold, so compared with Zillow they did quite well. Zillow pulled out of the iBuying market after their experience but Opendoor continued. Starting in January 2022, they resumed positive gross margins and things looked good for 3 months. Then the real trouble started.
When the market started to soften at the end of the first quarter of 2022, Opendoor failed to change tack and instead of pulling back on its buying, went into overdrive. They acquired a massive number of homes during the second quarter, mostly at prices that appeared to be ahead of their market value even then. By the time they entered the second half of 2022 they had amassed a huge inventory surplus of homes which would prove difficult to turn back into cash. During the third and fourth quarters they had to take action to dispose of this excess inventory, mostly by selling at prices substantially below their cost, and often, in their haste, below the market value too.
Buying above market and selling below market is not a recipe for financial success and even more so when the market is in decline. The resulting losses have taken their toll on both their balance sheet and stock price. Their profit and loss report was even worse than anticipated since they decided to write their unsold inventory down to estimated market value.
Here are the median sales and purchase prices we measured for Opendoor since August 2022 for Maricopa and Pinal counties:
Aug 2022 - $465,000, $494,200 - median loss of $29,200 per home (207 sales)
Sep 2022 - $418,581, $465,200 - median loss of $46,619 per home (509 sales)
Oct 2022 - $415,000, $470,000 - median loss of $55,000 per home (262 sales)
Nov 2022 - $409,000, $476,100 - median loss of $67,100 per home (287 sales)
Dec 2022 - $382,500, $445,500 - median loss of $63,000 per home (241 sales)
Jan 2023 - $390,000, $443,600 - median loss of $53,600 per home (229 sales)
Feb 2023 - $399,000, $455,500 - median loss of $56,500 per home (299 sales)
We have not yet compiled the data for March, but by now, Opendoor has managed to reduce its inventory to manageable levels. If we count their active listings on ARMLS, this has dropped from 1,800 in August to 284 today. This total is less their under contract count of 336, so the situation is back to normal and appears to be under control again. The majority of those homes are still worth less than the price they paid for them, but, with the write-downs already taken, they no longer need to resort to unusual techniques for selling them quickly. During the period September through January, Opendoor was the source of almost 1,500 homes. some at extreme bargain prices. That source has almost dried up, which is one more reason why home prices will probably rise over the next few months.
Mar 30 - Here is our latest table of Cromford® Market Index values for the single-family markets in the 17 largest cities
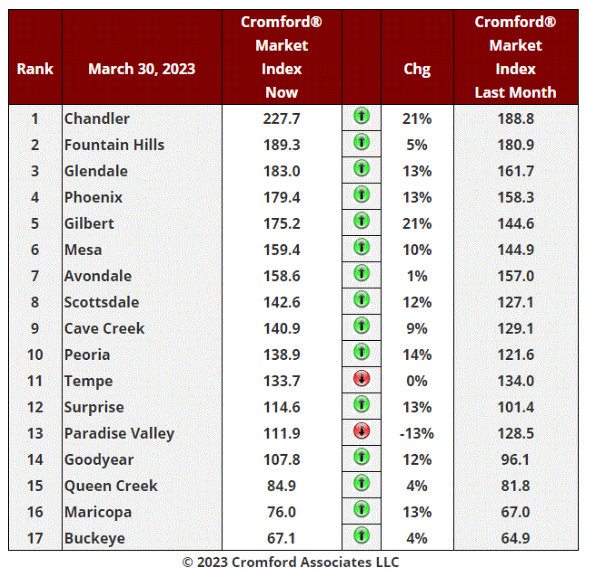
The market continues to improve for sellers with the average CMI up 9.0% over the last month. The improvement is slowly decelerating, having been 9.4% last week.
Still looking very strong are Gilbert and Chandler . These are both up over 20% from 4 weeks ago. Chandler's inventory is very low compared with normal and buyers must be frustrated to have so little to choose from.
Still doing relatively poorly are Paradise Valley and Tempe. However Paradise Valley has strengthened over the past few days and Temp has been improving for almost 2 weeks now.
We have 13 cities that are seller's market, 1 balanced and 3 buyer's markets. Among the 12 secondary cities, not shown in the table, we have 7 seller's markets (Anthem, Apache Junction, Arizona City, El Mirage, Gold Canyon, Laveen and Tolleson) while two (Sun City and Sun Lakes) are balanced and Sun City West, Litchfield Park and Casa Grande are buyer's markets.
Casa Grande is relatively weak, in a similar situation to Maricopa, with lots of new built supply and demand much lower than a year ago.
Mar 28 - The latest S&P / Case-Shiller® Home Price Index® numbers were published today.
The new report covers home sales during the period November 2022 to January 2022. As such it does not reflect at all the improving market we have seen over the last 3 months.
Comparing with the previous month's series we see the following changes:
1. Miami +0.09%
2. Los Angeles -0.22%
3. Boston -0.27%
4. Charlotte -0.28%
5. Atlanta -0.29%
6. San Diego -0.37%
7. New York -0.39%
8. Chicago -0.51%
9. Cleveland -0.61%
10. Detroit -0.65%
11. Washington -0.71%
12. Portland -0.72
13. Tampa -0.73%
14. Minneapolis -0.85%
15. Denver -0.87%
16. Dallas -0.95%
17. Phoenix -1.16%
18. San Francisco -1.33%
19. Las Vegas -1.41%
20. Seattle -1.43%
Phoenix has risen from 19th to 17th place but is well below the national average, which was -0.55%.
19 cities are in negative territory but Miami has turned around. San Francisco, Las Vegas and Seattle continued to see significant declines month to month, but Los Angeles and San Diego saw much smaller drops than last month.
Comparing year over year, we see the following changes:
1. Miami +13.8%
2. Tampa +10.5%
3. Atlanta +8.4%
4. Charlotte +8.1%
5. New York +5.2%
6. Dallas +5.0%
7. Cleveland +4.8%
8. Chicago +4.8%
9. Boston +4.2%
10. Detroit +3.2%
11. Washington +2.4%
12. Minneapolis +1.7%
13. Denver +1.0%
14. Los Angeles +0.9%
15. Las Vegas +0.4%
16. Phoenix +0.0%
17. Portland -0.5%
18. San Diego -1.4%
19. Seattle -5.1%
20. San Francisco -7.6%
San Francisco and Seattle are at the bottom of this table once again, and both are now significantly negative on a year over year basis.
Phoenix is in 16th place down from 15th last month and is flat comapred to a year ago.
Average sales prices have been rising in Phoenix over the past 2 months. However these sales are all excluded from the Case-Shiller calculations. It is likely that it will be another 2 months before we see the trend in the Case-Shiller HPI turn around for Phoenix.
Mar 27 - Sales pricing continues to strengthen and the average price per sq. ft. has now recovered to the levels we saw in September and October 2022.
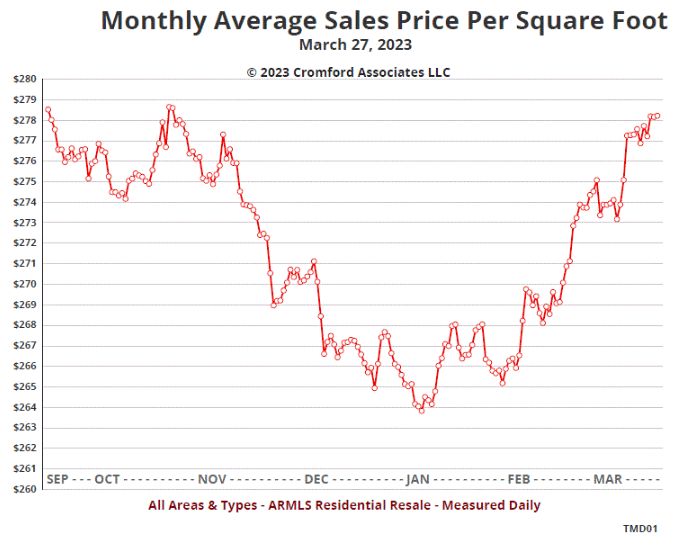
Mid-January, specifically January 16, was the low point of this cycle. Remember that closed pricing is a trailing indicator, but it has reacted surprisingly quickly to the improving situation for sellers. The low-point of prices for contract signings was during the latter half of November 2022.
The average 30 year FHA, 30-year VA, 15-year fixed and 30-year jumbo interest rates are currently below 6%, with the 30-year conventional at 6.54% and the 5/1 ARM at relatively unattractive 6.52%. These are all lower than a month ago. We anticipate improved demand for FHA and VA loans from borrowers, although lenders may be more selective when there is a background of bank failures in the news.
Mar 26 - The Census Bureau has provided new data for February 2023, but it confirms the same unusual trend that we saw in December and January. Single-family permits are very low while multi-family permits are very high.
It seems that the construction industry has collectively determined that the mix of homes in Maricopa and Pinal is going to change in favor of multi-family and away from single-family. This is probably a result of the low affordability we are now facing.
Full details are available in the Cromford® Public section.
Mar 24 - There has always been a lot of ill-informed, simplistic and childish speculation about the housing market. But these days dozens of these people have YouTube channels and the crazier their pronouncements, the more views they are likely to get. Views, and especially subscriptions and likes, mean cash for them from Google. That's why they do it, folks. They are not trying to be a balanced and astute observer of the market. They are trying to shock you. Selling disaster in all forms is a proven way to get attention.
I accept that this is a successful business model for them, but it is a terrible way to get your guidance about the housing market. I have been studying the housing market full-time since 2004 but the sheer recklessness of the pronouncements made on YouTube still amazes me. If your clients are watching these channels they are going to find out that real-life differs dramatically from the insane forecasts by these self-appointed experts.
As an example, let us take the simple example of foreclosures.
For the last 10 years I have been reading how foreclosures are going to spike and flood the market very soon. One day this forecast might come true. It tends to happen once every 50 years or so, and certainly did happen in 2006 through 2011. But the actual numbers, when read with intelligence and insight, blow this foolish forecast out of the water.
Obviously, during the COVID pandemic, there was a moratorium on foreclosures for residences that were occupied. This did not stop foreclosures for commercial properties, land or vacant homes. But as you can imagine foreclosure numbers dropped to very low levels while the moratorium was in effect. At the beginning, all the disaster-merchants forecast that foreclosures would explode to high levels as soon as the moratorium was terminated. Did this happen? No.
Is it happening now? No. Not at all.
Clearly when the moratorium stopped, foreclosures increased, but by a surprisingly small amount, to reach a extremely low level compared with the long-term average. You-Tubers can twist these tiny numbers to fit their story - foreclosure up by 200%!!
200% of a tiny number is still tiny. And it is also exaggerated. Foreclosures are actually up by 100%!! And that is far less than anyone expected, including me.
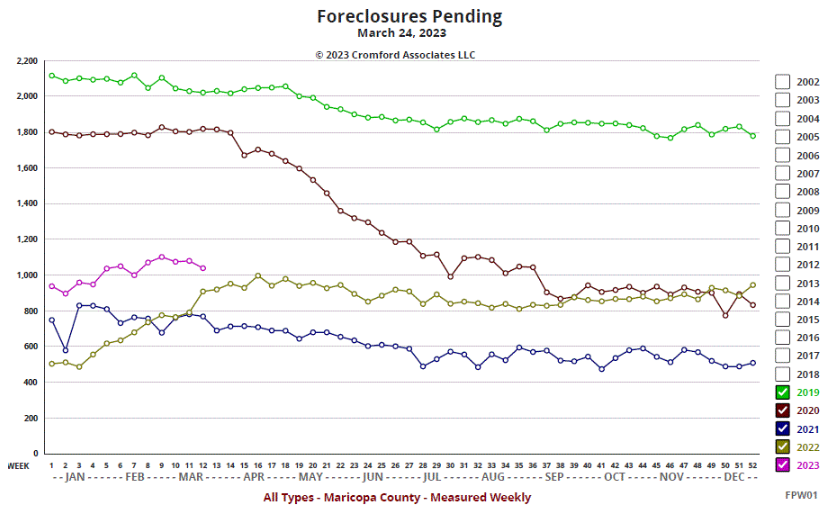
Note that pending foreclosures are Notices of Trustee Sale that have not yet been cancelled or resulted in a Trustee Deed. They are not foreclosed homes, which are those that have been through a Trustee Sale. Only a small percentage of pending foreclosures result in an actual foreclosure. The vast majority are cancelled. This is often because the borrower either finds a way to get current on their loan or pays off the mortgage by selling their home. There is a strong incentive to do this when the homeowner has substantial equity in the home. Very often home equity represents the bulk of that person's wealth. Why throw it away?
Before COVID, in 2019 we were seeing a low and stable number of pending foreclosures around 2,000 to 2,200. In fact it was the quietest year for pending foreclosures that we had ever measured up to that point. The busiest years were 2009 and 2010. Then we had over 50,000 pending foreclosures. This was a lot. You have my permission to panic if we ever get to that level again.
Anything below 5,000 can be considered a low level of foreclosures. 5,000 to 10,000 is normal and over 10,000 is high.
2020 was shaping up to be even quieter for foreclosures than 2019, but when the moratorium was introduced, the monthly level dropped to record lows of between 800 and 1,000. This can be considered extraordinarily low for a county the size of Maricopa. By the time the moratorium was lifted, pending foreclosures had declined a to level I would have previously considered impossibly low - around 500. That is just 10% of the bottom of the normal range.
And then when the moratorium ended, pending foreclosures almost DOUBLED to between 800 and 1,000. But the 1,000 level is still only 20% of normal. The current count is trending slowly higher, but remains unusually low and shows absolutely no sign of getting back to normal, never mind excessive, anytime soon.
Compilers of lenders' loan performance reports, such as Core-Logic, tell us that delinquency remains at a very low level. These reports will provide an early warning if foreclosures may be coming back in fashion. At the moment they are not showing any warning signs at all.
A rule of thumb. If pending foreclosures stay below 8,000, you need not be worried about a wave of foreclosed properties hitting the market. 10,000 is about the maximum the market can absorb without running into problems. I would consider it worth worrying if we break through 8,000. We currently have just over 1,000. You can check the chart above every month to confirm whether you need to worry or not. Not, is the current correct answer.
Another useful rule of thumb; if someone tells you there is a foreclosure wave coming in 2023, you can safely ignore everything that person tells you about the housing market. Most likely that person said the same thing about 2022 and every year before that. No need to argue, just ignore what they tell you.
Mar 23 - Here is our latest table of Cromford® Market Index values for the single-family markets in the 17 largest cities

The market continues to improve for sellers with the average CMI up 9.4% over the last month. The improvement is slowly decelerating, having been 11.0% last week and 12.6% two weeks ago.
Still looking very strong are Gilbert and Chandler . These are all up over 20% from 4 weeks ago.
In contrast, doing relatively poorly are Paradise Valley and Tempe. Paradise Valley looks likely to fall into a balanced market within the next week, with demand falling and supply on the rise. The rest of the Northeast Valley is looking stronger. Tempe gives the impression is is turning around, with its CMI up over the last week.
Demand has been affected by the higher interest rates that have prevailed during February and early March. However rates tumbled dramatically yesterday, so we could see some improvement in both demand and supply if the current rates persist. They have been extraordinarily volatile recently with the 30 year FHA rate dropping from 6.20% to 5.75% in just a single day. The VA rate has declined 50 basis points in 2 days, but the 5/1 ARM has risen from 6.14% to 6.55% during the last 3 days. I can't remember a time when interest rates jumped up and down so fast and frequently. However, FHA and VA loans look particularly attractive right now which will favor the low to mid-range market below $900,000.
We now have 13 cities that are seller's market, 1 balanced and 3 buyer's markets. These latter 3 at the bottom of the table have far more supply than most other areas but they are rather far from the center of Phoenix, which tempers demand a little. Competition from new builds is strong for anyone re-selling a home in Buckeye, Maricopa and Queen Creek.
Mar 20 - The Cromford® Market Index has slowed its upward trajectory this week:
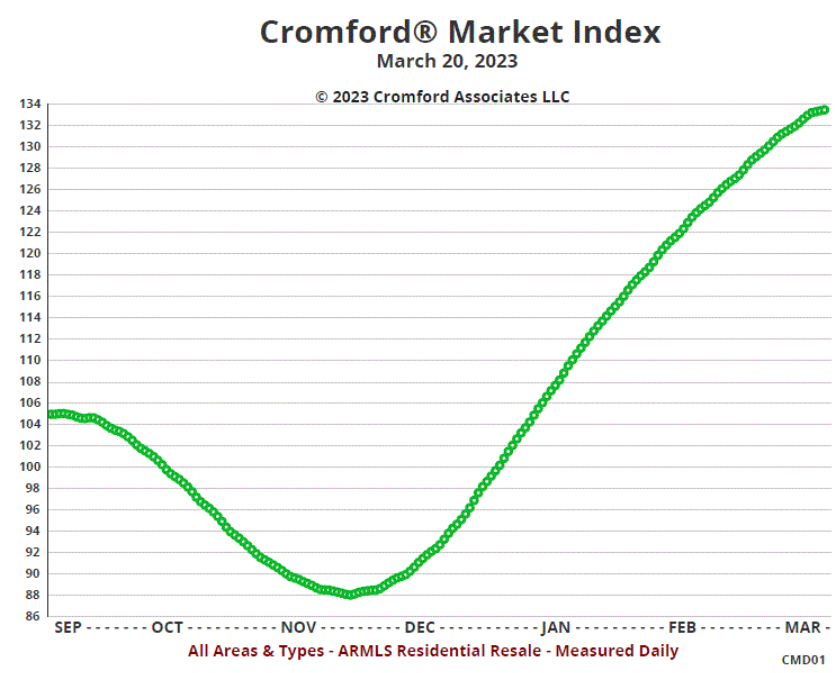
In the last 3 days we have only seen a rise of 0.2, a significant slowdown compared to a week ago when we saw a rise of 0.7.
The culprit is the Cromford® Demand Index which peaked at 83.5 on Friday (still well below normal level of 100) and fell back slightly, reaching 83.1 today. Demand is no longer increasing. This is not due to interest rates, since these have fallen as a result of the current banking crisis. It may be a result of additional fear and uncertainty introduced by the banking crisis. People will naturally feel more cautious when banks are failing and having to be rescued.
The Cromford® Supply Index is still in free fall at 62.2, and is currently dropping faster than demand is falling. Sellers are likely to feel just as uncertain as buyers in the middle of a banking crisis. However the trend is less positive for sellers than a week ago when demand was rising and supply was falling.
The CMI is very sensitive and needs watching closely to see if we are stabilizing or at an inflection point.
Mar 19 - Although closed unit counts are weak, dollar volume is quite respectable at $3.5 billion per month. See the chart below:

People are spending roughly the same amount (slightly more in fact) on purchasing homes as they were in March 2020, just before the COVID pandemic threw everything into disarray. On that basis the market looks quite reasonable.
However the average price in March 2023 is $540,728, whereas in March 2020 it was only $377,737. As the average house costs 43% more, the same dollar volume buys a lot fewer homes, as we saw in yesterday's chart below.
We should probably consider a spending power of $3.5 billion a month as normal and the time period between July 2020 and July 2022 as an aberration when monthly spend rose beyond $4 billion and even hit $6 billion in spring 2022, fueled in part by the unnatural appetites of the iBuyers and institutional investors. These appetites have been sated.
Since commissions are usually based on dollars rather than units, this means potential commission earning levels in March 2023 are actually better than they were in March 2020. And with prices starting to edge upward again, dollar volume will increase even if unit volume stays flat.
Mar 18 - Compared to last year, the sales rate is very low:
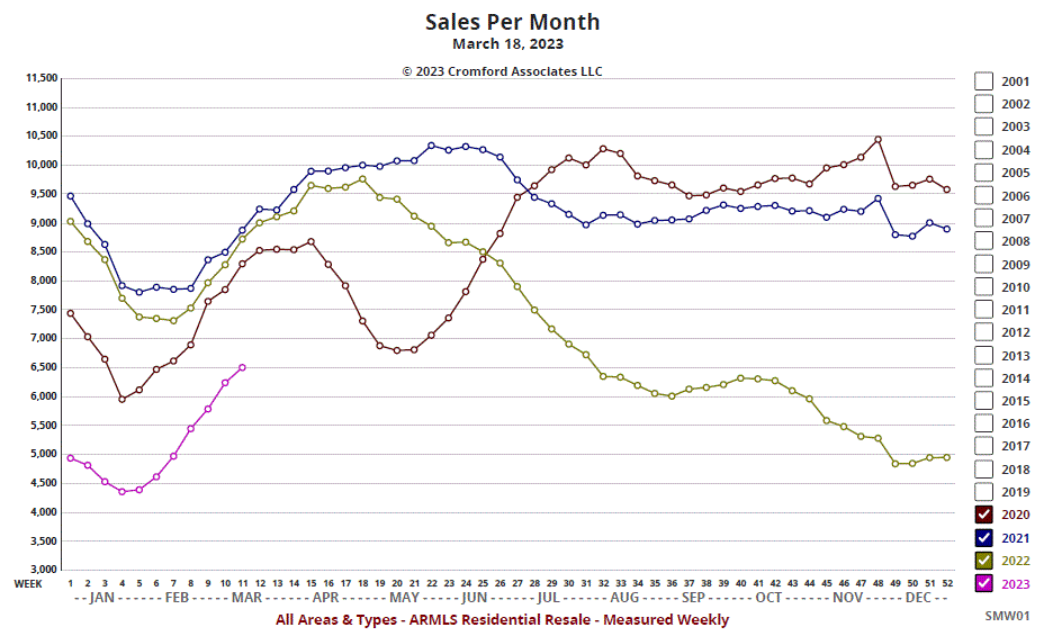
This week we are recording a closed sales rate of 6,509 per month across all areas & types. This is some 25% below last year at week 11. However, this is a significant improvement of where we were at the end of last year, when sales were 44% lower than a year earlier.
Declines in unit volumes are severe in certain special categories of closings:
iBuyer purchases - very few and far between compared to a year ago - down about 95%Zillow down 100%
Redfin down 100%
OfferPad down 100%
Opendoor down 93%
iBuyer sales are also down more than the overall market - they are about 62% below 2022 levels, although Opendoor has recently stepped up sales, especially to one institutional buyer
Institutional investor purchases are down around 69%.
Flips are down 50%
But some areas are more healthy than average:
New homes are barely down from last year
Pre-foreclosures are up 34% (but from a tiny number to another slightly less tiny number)
Wholesale transactions are down only 13%
Normal owner-occupier transactions are what is sustaining market momentum. Normal owner-occupied purchases of newly constructed homes are surprisingly strong and given the very weak permit counts, new homes could be in short supply quite soon.
Mar 16 - Here is our latest table of Cromford® Market Index values for the single-family markets in the 17 largest cities
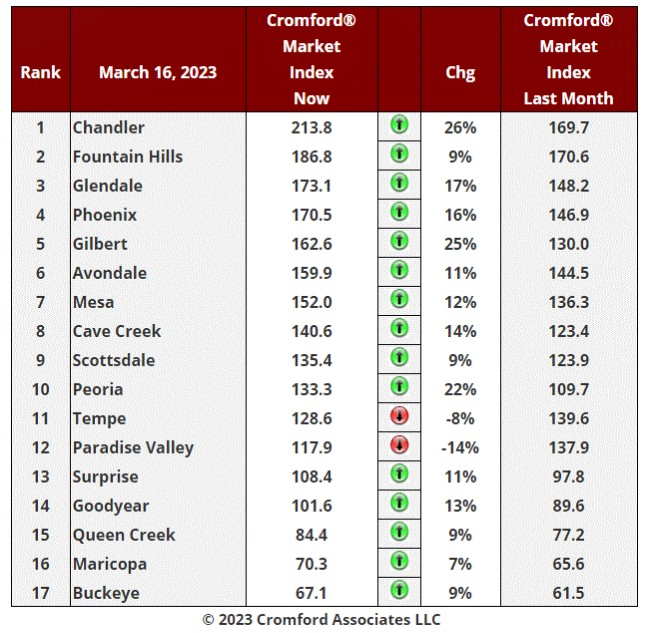
The market continues to improve for sellers with the average CMI up 11.0% over the last month. This increase is slowly decelerating, having been 12.6% last week.
Looking especially strong are Gilbert, Chandler and Peoria . These are all up over 20% from 4 weeks ago.
Still doing relatively poorly are Paradise Valley and Tempe.
Demand is stable and no longer growing very fast, but supply is low and is falling at a faster rate.
Among the secondary cities, Arizona City, Casa Grande, Litchfield Park, Sun City and Sun City West are weakening for sellers, while Apache Junction, El Mirage, Gold Canyon, Laveen and Tolleson are improving fastest.
Mar 15 - The monthly average $/SF for closed listings stands at $273.22, up from $268.24 a month ago, which was also up from $264.13 on January 15.
This means the average $/SF for closed listings has jumped by 3.4% in just 2 months.
Who is still holding out for a housing market crash?
Mar 13 - Looking at the daily CMI chart, we can see that the higher mortgage rates since January have had little impact on the market balance, which has moved further in favor of sellers rather than in favor of buyers, as most people were expecting.
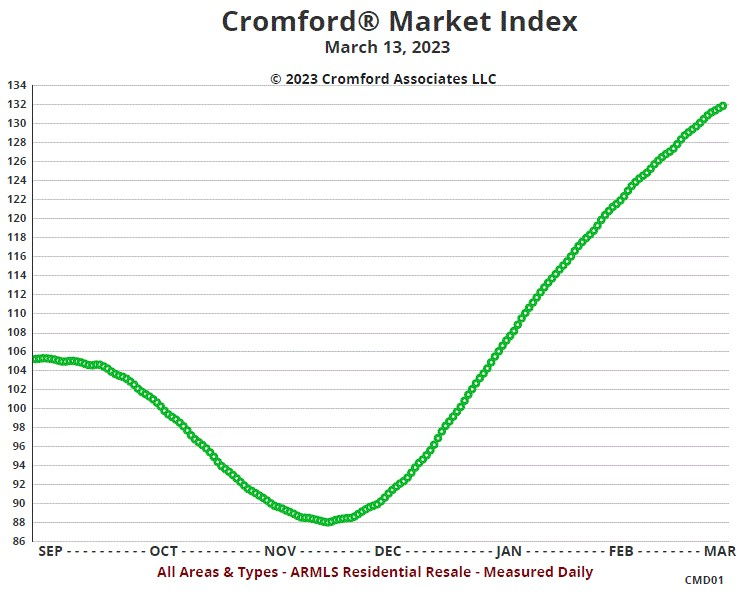
At 131.9 the current index is firmly in favor of sellers and underlines why prices are rising again.
The buyer's market (CMI under 90) lasted from November 15, 2022 to December 11, 2022. Not much of a window of opportunity, less than a month in fact. But buyers brave enough to take the plunge during that period probably got a very good deal, especially if they were purchasing from Opendoor or OfferPad. Buyers in January were also rewarded with low interest rates by today's standards. Affordability is now worse, but demand is holding up remarkably well. Supply is low and continues to tighten and looks set in for a long term downward trend.
Anyone who is hoping for a flood of supply from foreclosures is living on a different planet from our real world. Based on the number of Notices of Trustee Sale being recorded, there is absolutely no sign of this becoming a possibility. In the YouTube world perhaps, but not on Planet Earth.
In the last 2 working days, the typical 30-year fixed loan rate has dropped from 7% to 6.57%, so this dramatic fall could stimulate more demand in coming weeks. The FHA rate is down to 6.10% from 6.54% on March 8.
Rates are extremely volatile at the moment, so forecasting is unusually tricky. But the widespread desire to own a home is unchanged. The main inhibitor for younger first-time buyers appears to be coming up with the down-payment. A surprisingly large percentage of would-be buyers can qualify based on the the monthly cost. Now that they are feeling a fear of missing out, we might see a spike in demand which could move market volumes back towards normality.
Mar 12 - Analyzing the Maricopa County recordings for February we see that the iBuyers bought very few homes but continued to sell off the large inventory they paid too much for last year.
Opendoor purchased 20 Maricopa County homes during February, but sold 243. This was their best selling month since September 2022.
OfferPad purchased no Maricopa County homes at all in February, but sold 65. This was their best selling month since May 2022.
Large scale institutional investors are buying far more than iBuyers with 118 acquisitions in February. However this is far below February 2022 when they purchased 531.
Wholesalers are active again after 4 months of low volumes. They had 110 closings, only slightly below the 127 we saw in February 2022.
REO sales, pre-foreclosures, short sales and trustee sales all remained very low during February. No sign at all of a wave of distress occurring.
Mar 9 - Here is our latest table of Cromford® Market Index values for the single-family markets in the 17 largest cities
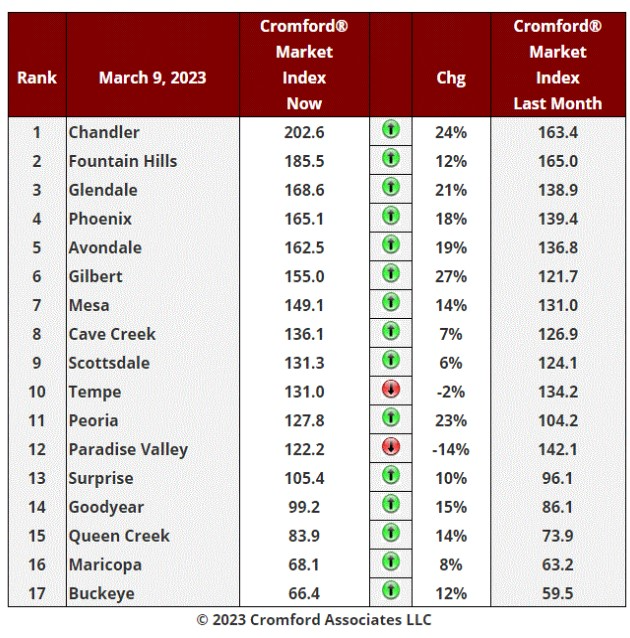
The market continues to improve for sellers with the average CMI up 12.6% over the last month. This increase is slowly decelerating, having been 13.4% last week.
Looking especially strong are Gilbert, Chandler, Peoria, Phoenix and Glendale. These are all up over 20% from 4 weeks ago.
Still doing relatively poorly is Paradise Valley, but Cave Creek has turned around. Scottsdale looks better for sellers too.
Tempe is surprisingly weaker compared with all its Southeast Valley neighbors.
We still have 3 cities in a buyer's market, with 2 in balance and 12 in a seller's market. The 4 cities at the bottom of table are again looking much stronger than they did a month ago, particularly Goodyear and Queen Creek.
The improvement in the market is going to surprise many people, given the increase in the typical mortgage interest rate over the past month.
Mar 8 - The majority of people seem to assume that the rise in mortgage rates over the past 5 weeks will have caused home buyers to reconsider and delay their purchases. While there may be some, or even many who have done just that, reports from new home sales offices suggest that orders have stayed remarkably strong. Sales incentives are not being raised and I fear that the result will be another shortage of homes to buy within a few months.
The reason I have this fear is that new home construction permits have been extremely few in number and trending lower. Indeed January's permit count for single-family dwellings in Maricopa and Pinal numbered just 1,102, following the even more dismal count of 997 in December. These numbers are down from the 3,000 level during most of the second half of 2020, all of 2021 and the first half of 2022. Yet new home closings are currently down only 5% year over year in Maricopa county and order books are filling up.
It is obvious from these trends that home builders are not starting enough homes to replace the ones that are going under contract. We all know how that story is likely to end.
New homes have been gaining market share over re-sales but this will come to a grinding halt if new homes supply runs short. At the moment new builds are a dominant force in the market, but they will only remain so if we see permits climb much higher in he next few months.
Meanwhile the media are getting it all wrong. Witness the story in the Wall Street Journal "Housing Market Momentum Stalls as Critical Spring Season Approaches".
There is a widely held belief that rising interest rates always mean falling demand. This is sometimes true but surprisingly often untrue. Housing affordability gets worse when interest rates rise, but if the buyers' perception is that it may get even worse in the future, this brings on a fear of missing out (FOMO) and a desire to buy right now before rates rise further. This appears to be what we are seeing, particularly in the new home market. It also follows that what buyers want is a house they can buy quickly, while their rate is locked. They therefore want a spec home or one that is very close to completion. Homes that are built-to-order are still many months away from closing, so the interest rate is very hard to lock in today. Buyers are finding that the home they wanted just went under contract with someone else. Inventory is falling. Motivation builds into determination to buy something before affordability disappears out of range. Over the January period, home builders were routinely buying down mortgage interest rates to around 5%. We are now closer to a 6% target after the rate has been bought down from around 7%. Buyers who are actively looking realize what is going on and fear that if they wait they may be looking at a 7% rate bought down from 8%. They hear what Jerome Powell, FOMC Chairman, is saying and this only reinforces their FOMO.
Last year we suffered from FOBAT (fear of buying at the top) which caused demand to collapse and prices to follow suit.
There are still buyers cancelling their new home orders, either in fear or because they can no longer qualify for their mortgage. However builders now see a cancellation as an asset that they can sell for a higher price. They are already short of quick delivery homes (QDH). When these run very low buyers will probably have to turn to the re-sale market to fulfill their needs.
Mar 6 - It is possible that you are skeptical when I claim that prices are heading higher. List prices have been moving up for several months but sales prices, not so much. Until now that is. Look at the daily chart below:
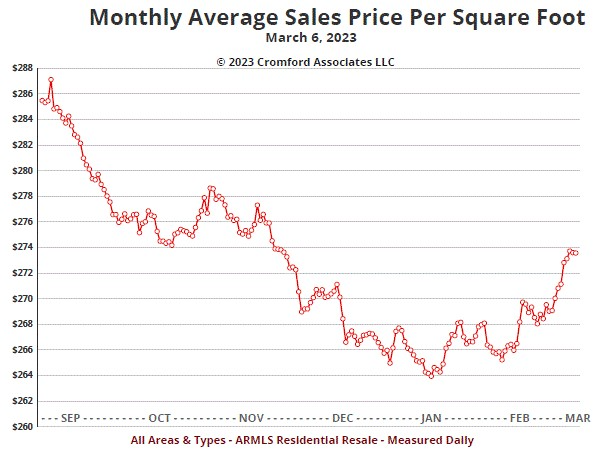
The $264 we hit in the middle of January is now well behind us and we are threatening to breach the $274 level. We may hit some resistance at this level, but there is also positive news coming from the percent of list department. Right now homes are closing for an average of 97,2% of list. This is well up from the 96.5% we saw during January and the best reading since October.
The Federal Reserve will not like these signs as they want prices to come down. This may result in interest rates moving higher again. This may suppress demand, but it may also make buyers think current rates are better than future rates, justifying a purchase decision now rather than later. That could be a wise move if prices and rates both rise.
Mar 5 - With mortgage rates much higher than 4 weeks ago, many people have turned to pessimism about the housing market. However, interest rates are just one of many things that determine how the market behaves. We advise you not to obsess about them but pay attention to many other factors.
Look at the chart below and you can see how the listing success rate has improved sharply since week 4. A normal market generates a listing success rate of around 65%, whereas we are heading towards 80%, consistent with a market where supply is unable to keep up with demand.
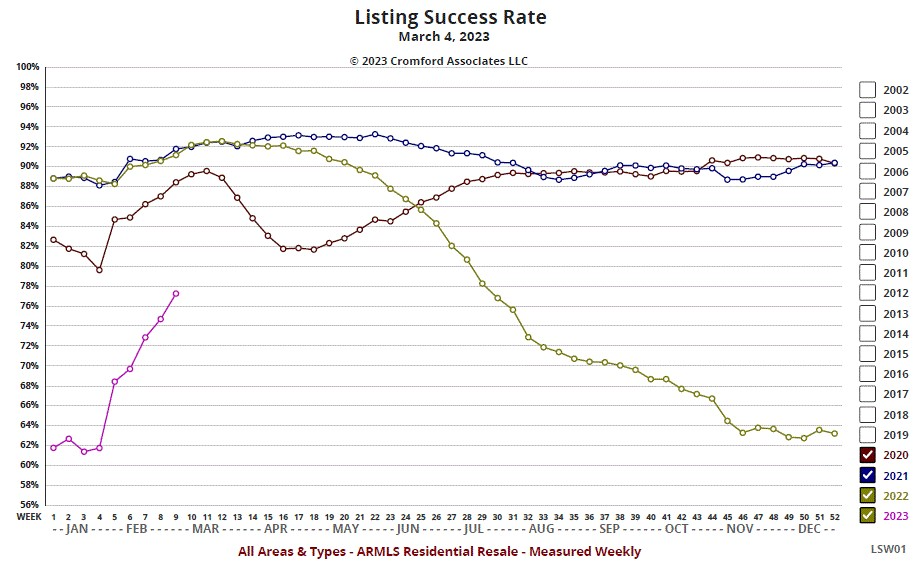
There is no denying that demand remains weak compared to normal, because affordability is poor. However the same factors that make affordability poor also make homeowners reluctant to sell their homes. Focusing exclusively on the demand side of the equation will make you sad. Look also at the weakness of supply, which shows no sign of improvement. With a decreasing number of homes going on sale, those that do have an increasing chance of a successful sale. We are recording fewer cancellations and fewer expirations. This is a positive readout, folks. And it is based on cold hard numbers not opinions of how the market "ought" to be behaving.
The volume may be low, but the market is operating with great efficiency and it is getting easier to sell a home, not harder.
Mar 4 - The Affidavits of Value have been processed from Maricopa County for February and we deduce:
There were 5,910 closed sales - down 35% from February 2022, but up 30% from January.
There were 1,208 new home sales - down only 5%.
There were 4,702 re-sales - down 40%.
The monthly median sales price was $440,000 - down 3.3% from February 2022, but up from $439,000 last month.
The new home median sales price was $514,776 - up 7.8% from February 2022.
The re-sale median sales price was $420,000 - down 6.7% from February 2022, but unchanged from last month.
Once again new homes are faring much better than re-sales in both volume and pricing.
These numbers are for single-family and townhouse/condo homes combined.
Mar 2 - Here is our latest table of Cromford® Market Index values for the single-family markets in the 17 largest cities
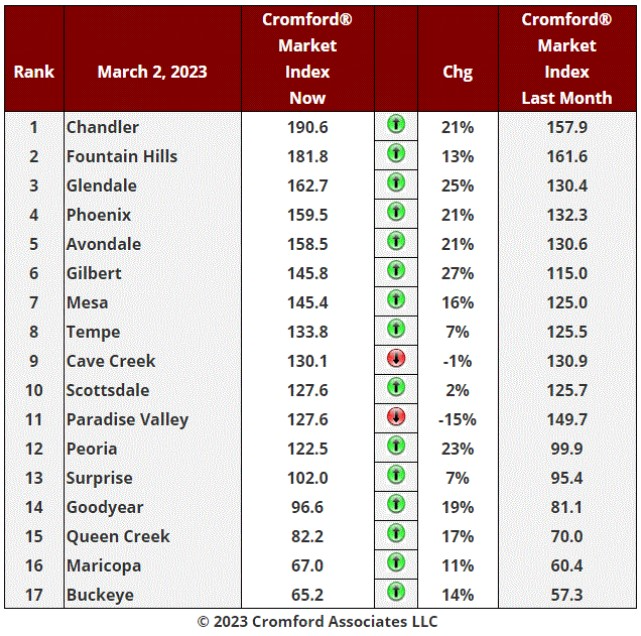
The market continues to improve for sellers with the average CMI up 13% over the last month. This increase is starting to decelerate, almost certainly due to the dampening effect of higher mortgage rates. However it is still a substantial increase and much more positive than we were expecting to see back in the fourth quarter of 2022.
Looking especially strong are Gilbert, Glendale, Peoria, Phoenix, Chandler and Avondale. These are all up over 20% from 4 weeks ago.
Not doing so well is Paradise Valley which has seen a rise in available supply, contrary to what is going on elsewhere. Cave Creek is also slightly weaker.
Tempe, Scottsdale and Surprise are relatively unimpressive, but still giving us a positive movement compared to last month.
We still have 3 cities in a buyer's market, with 2 in balance and 12 in a seller's market. However the 4 cities at the bottom of table are looking much stronger than they did a month ago, particularly Goodyear.
Mar 1 - The contract ratio for all areas & types has risen above 60.
This means we are officially in a hot market again.
You should therefore anticipate house price rises over the coming months, no matter what you read in the media, which tends to base their reports and projections on housing data that is one to several months out of date, such as the S&P Case-Shiller® Home Price Index®.
The opportunity to buy at the bottom of the correction occurred in the fourth quarter of 2022. Congratulations if you bought when everyone else was fearful. That was good market timing.
Feb 28 - The latest S&P / Case-Shiller® Home Price Index® numbers were published today.
The new report covers home sales during the period October to December 2022. As such it does not reflect at all the improving market we have seen over the last 8 weeks.
This reminds us that anyone paying attention to the Case-Shiller HPI numbers is looking into the distant past, not the market as it operating today.
Comparing with the previous month's series we see the following changes:
1. New York -0.20%
2. Miami -0.28%
3. Washington -0.43%
4. Atlanta -0.74%
5. Cleveland -0.78%
6. Los Angeles -0.80%
7. Boston -0.90%
8. Tampa -0.95%
9. Charlotte -0.99%
10. Detroit -1.07%
11. Dallas -1.08%
12. Chicago -1.19%
13. Minneapolis -1.24%
14. San Diego -1.32%
15. Denver -1.32%
16. San Francisco -1.82%
17. Las Vegas -1.84%
18. Seattle -1.81%
19. Phoenix -1.87%
20. Portland -1.89%
Phoenix has risen from 20th to 19th place but is well below the national average, which was -0.81%.
All 20 cities are in negative territory month to month and the Southeast has started to decline faster, especially Charlotte and Tampa. Once again, New York and Washington were among the top three performers. The Pacific Coast cities continue to be severely affected by the downturn especially the extremely expensive locations of San Francisco and Seattle. Denver and Las Vegas have also joined them in the bottom 6.
Comparing year over year, we see the following changes:
1. Miami +15.9%
2. Tampa +13.9%
3. Atlanta +10.4%
4. Charlotte +9.9%
5. Dallas +7.9%
6. New York +6.6%
7. Cleveland +6.0%
8. Chicago +5.9%
9. Boston +5.2%
10. Detroit +4.5%
11. Washington +4.3%
12. Las Vegas +3.6%
13. Denver +3.6%
14. Minneapolis +3.2%
15. Phoenix +2.9%
16. Los Angeles +2.7%
17. San Diego +1.6%
18. Portland +1.1%
19. Seattle -1.8%
20. San Francisco -4,2%
San Francisco and Seattle are at the bottom of this table once again, and both are now negative on a year over year basis.
Phoenix is in 15th place down from 11th last month.
Average sales prices have been rising in Phoenix over the past month, although not by a large percentage. It is likely that it will be another 3 months before we see the trend in the Case-Shiller HPI turn around for Phoenix.
Feb 25 - The supply of homes priced over $1 million is healthy at 1,882 across Greater Phoenix, excluding UCB and CCBS listings. Last year at this point there were only 709. The trend is upwards too, though not dramatically so. The supply situation is similar to 2019 for the luxury sector. The normal seasonal pattern would see it peak in March and then decline until the end of August.
Below $1 million, supply is falling. We currently have 12,682 active listings, excluding UCB and CCBS, and at the same time in 2019 we had 16,612.
When supply is falling it usually means greater pressure on buyers and more negotiation power for sellers. In the outer areas, such as Maricopa, Buckeye, San Tan Valley and Casa Grande, supply is constantly being created in the form of new construction. However in many of the inner areas, there are fewer vacant sites left for building and supply gets tighter quickly. The more central cities of Chandler, Glendale, Phoenix, Avondale, Gilbert and Tempe are experiencing tighter supply forcing buyers further out if they want plenty of homes to choose from.
Across Phoenix we only see 2,076 active listings below $1 million, which is low compared with 3,919 at the same point in 2019. Mesa has more areas available for building and active listings number 1,215. This is only a tad below the 2019 reading of 1,244. This is probably one of many reasons why the average $/SF for Phoenix is rising while that for Mesa is more stable.
Feb 23 - Here is our latest table of Cromford® Market Index values for the single-family markets in the 17 largest cities
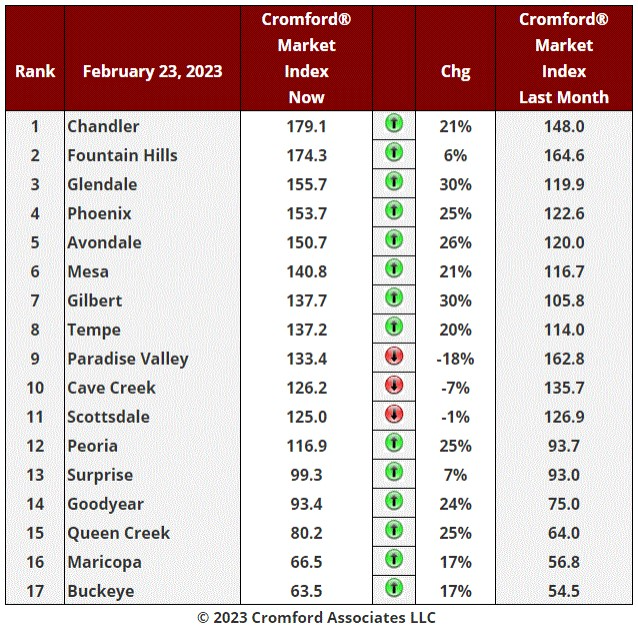
The era of leadership by the Northeast Valley is clearly over and the Southeast Valley, Central Valley and West Valley are all now taking over the market leadership role.
Chandler has overtaken Fountain Hills to take the number one spot, though the market in Fountain Hills is faring much better than the rest of its Northeastern neighbors.
Paradise Valley has plummeted from almost 170 in mid-January to 133 now, moving significantly in favor of buyers.
Most cities have moved strongly in favor of sellers, particularly Glendale, Gilbert, Avondale, Phoenix, Queen Creek, Peoria, Goodyear, Mesa, Tempe and Chandler. As a result prices are now starting to climb again, marking the end of the correction that started roughly 8 month ago.
We still have 3 cities in a buyer's market, with 2 in balance and 12 in a seller's market.
Feb 22 - The positive signals continue to grow despite the gloomy trend in mortgage interest rates. With each passing week, fewer listings are getting cancelled, fewer are expiring and more are going under contract. We can see this clearly from the listing success rate chart:
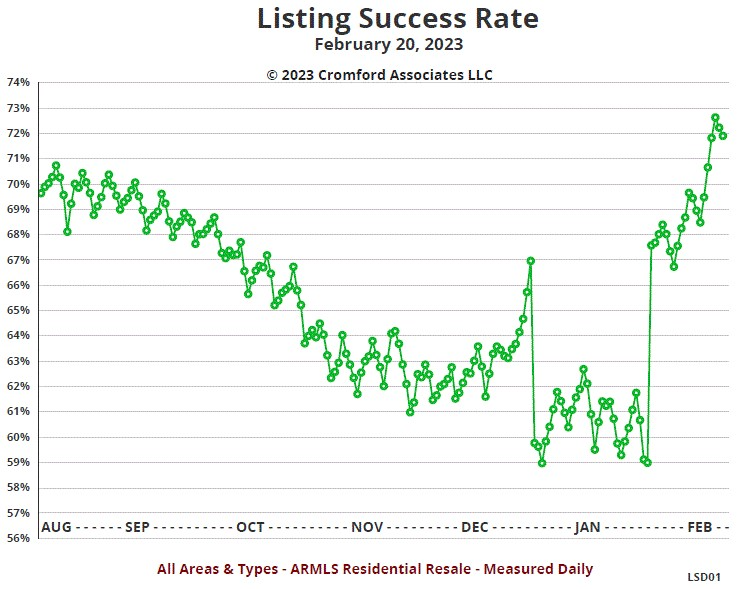
First, we need to make the obvious point that there is always a disconnect in January due to the large number of listings that expire on Dec 31 each year. We need to ignore the drop and the rise one month later and instead focus on the overall trend.
We can see that the listing success rate hit a low point of 61% around Thanksgiving 2022. We have now recovered to the 72% mark. This is actually better than average, though we were around 85% to 95% during the crazy COVID period. We are observing a remarkably fast recovery that appears to have some staying power.
We can see from the Tableau Listing Success Rate Chart that the improvement applies to all price ranges. The highest success rate (82%) applies to listings priced between $250,000 and $300,000 and this is up from 69% in the last 6 weeks of 2022.
Feb 20 - The short-term picture on pricing is getting more positive for sellers with each passing day.
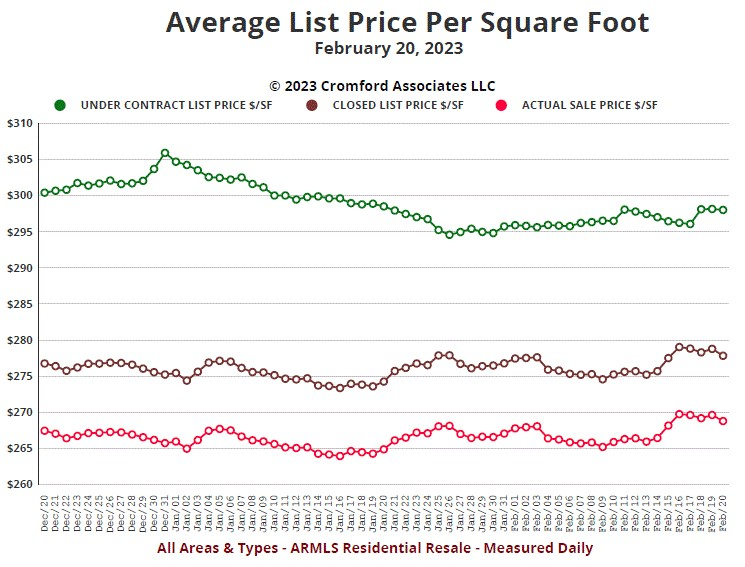
The average $/SF for listings under contract refused to drop below $295 and is now making a challenge to break through $300 again.
The monthly average $/SF for closed listings has been on an upward trend since mid January. The trend is weak but is becoming clearer as the month progresses.
Any buyers who are waiting for prices to fall further are probably going to be disappointed. The Cromford® Market Index is now over 120 and that strongly suggests firmer pricing ahead.
However it is possible that mortgage interest rates may get worse for buyers. The average 30-year fixed rate is already over 6.75% and heading for 6.875%. Last month we saw an average rate of 6.20%, so affordability has deteriorated.
The main problem for those who are hoping for a price collapse is that supply remains stubbornly low and continues to move downwards. There is absolutely no evidence of a supply wave coming towards us. Quite the opposite in fact, as new homes will be scarcer in the coming months because of the low number of permits that have been issued over the past 6 months.
Feb 18 - With interest rates noticeably higher than in January, there is less enthusiasm in the air from buyers. There were only 1,822 new contracts accept last week, noticeably lower than the previous 2 weeks which were all around the 2,000 mark.
On the other hand, sellers have turned down the rate of new listings arriving, so demand and supply are both weakening from the same interest rate movement.
The result is that we still see the market balance moving in favor of seller which will help support pricing. The volume of transactions will not rise as quickly as it would have if rates had stayed as low as January. We are still seeing increased closed transaction rates, as you would expect for the time of year. The listing success rate has also recovered and now stands over 70%, consistent with a healthy market.
Basically the correction in pricing has run its course and we are now back in a normal market, far less frenetic than we experience between 2020 and 2022.
Feb 16 - Here is our latest table of Cromford® Market Index values for the single-family markets in the 17 largest cities
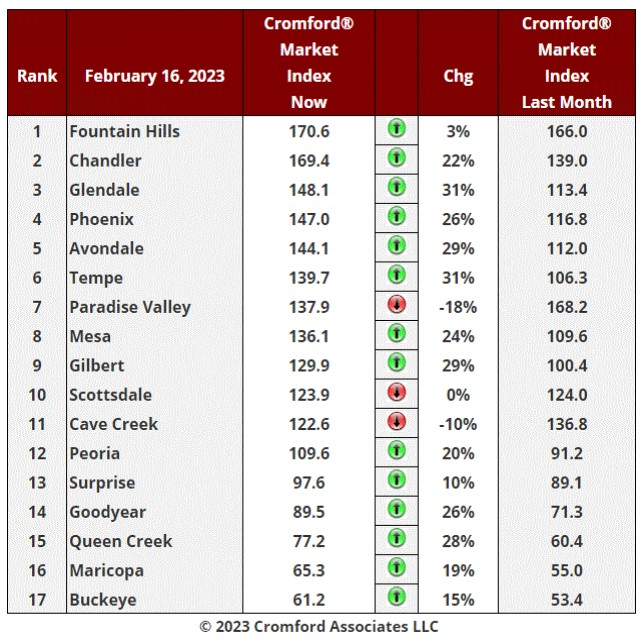
Fountain Hills held off the strong challenged by Chandler and remains in first place, for now. The rest of the Northeast Valley is clearly deteriorating for sellers, especially Paradise Valley where supply is rising and demand falling. The rest of the Central Arizona market continued to improve for sellers over the last month. Top areas include Tempe, Glendale, Avondale, Gilbert, Queen Creek, Goodyear, Phoenix and Mesa, all locations where the CMI increased by 24% or more.
Higher mortgage rates since January are starting to slow the recovery in demand, but they are also discouraging potential sellers. The net effect is still positive, but the return to normal volumes is going to take a little longer than it appeared two weeks ago.
We still have 4 cities in a buyer's market, with 2 in balance and 11 in a seller's market.
Feb 15 - The recovery in listings under contract since the start of January has been spectacular, as can be seen from the chart below.
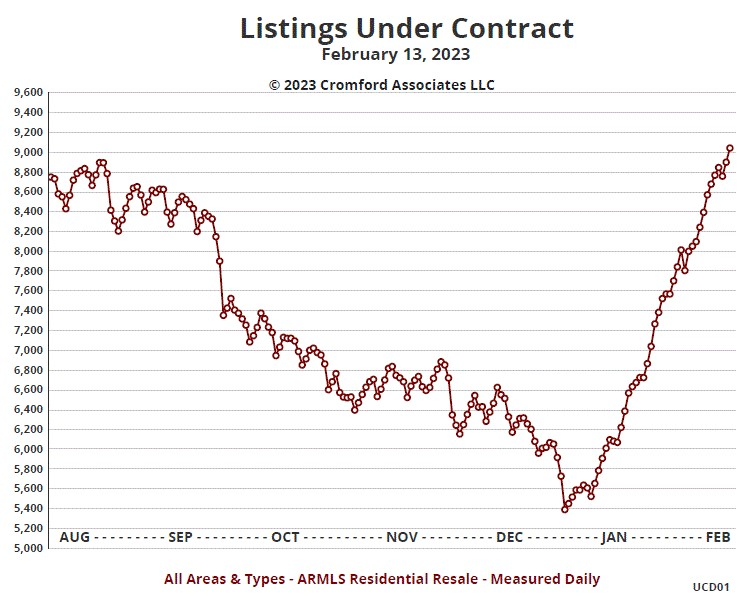
Of course, this was from a very low start below 5,400 but cracking the 9,000 by mid February is impressive. We remain 27% below the count on February 13, 2022, so we are really back to normal rather than the wild and crazy market we had 12 months ago.
If we can stay over 9,000 for several months, we will have established "relief" as the next stage of the market cycle, and optimism will be appropriate for the second half of the year. That is an uncertain if, but not an unlikely one.
Feb 14 - The six-month list price per square foot chart supports the theory that the market is improving for sellers.
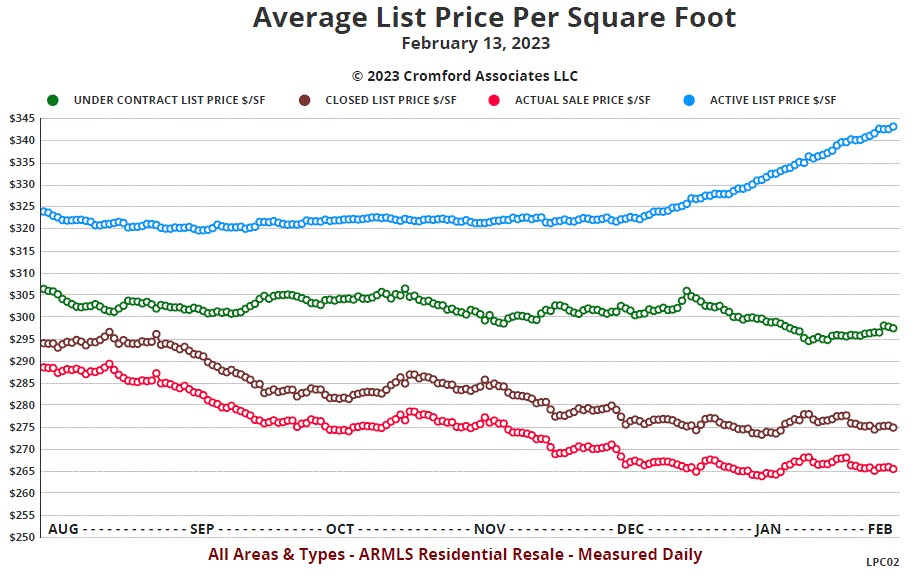
We can immediately see that sellers have become much more optimistic on pricing since mid-December, with the average $/SF for active listings up from $322 to $343, a rise of 6.5% in just 2 months.
The average $/SF for listings under contract had been on a slow downward trend, but hit bottom on Jan 26 and has been on a very mild and somewhat unconvincing upward trend since then.
The average $/SF sales price for closed listings has been trundling along around $265 since mid December and is showing little intention of dropping further at this point. In the current environment we would be surprised to see it hit new lows but things could change if demand were hit by another significant rise in mortgage rates.
Supply remains weak by long term standards.
Feb 13 - We are seeing about 2,000 accepted contracts a week for Greater Phoenix. The good news is that this is much higher than during the fourth quarter of 2022, when we never exceeded 1,500 accepted contracts per week and dipped below 1,200 three times. The bad news is that we have been stuck at the 2,000 level for 3 weeks and it would be nice to get back to the same level as last year when we hit 2,200 or more in most weeks. The recent up-tick in interest rates is pouring some cold water on the buyer enthusiasm that emerged during January and it is hard to say if this will have a small or a large effect on the market as a whole.
Certainly there were 1,988 contracts accepted during the week starting February 5, down from 2,015 the week before. The fact that it is down is bad, but the fact that it is only down 27 is good.
As you will have guessed by now, I am on the fence until we see more data roll in.
Feb 9 - Here is our latest table of Cromford® Market Index values for the single-family markets in the 17 largest cities
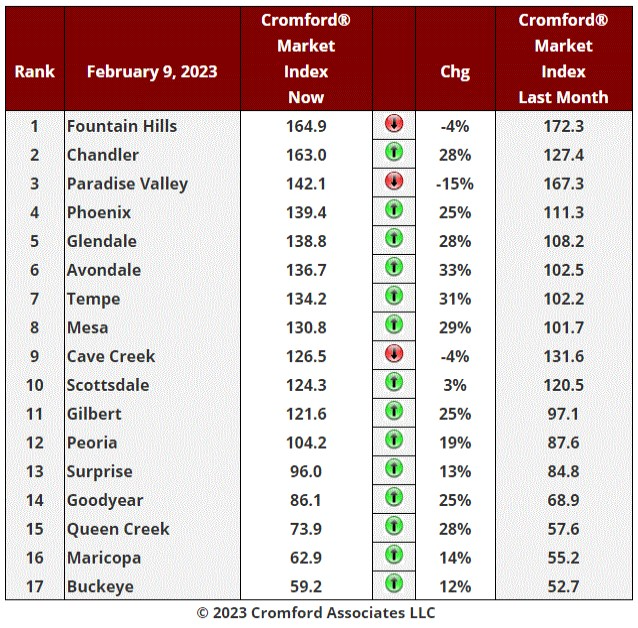
Fountain Hills continues to hold the top spot but is being challenged by Chandler. The Southeast Valley is improving very fast while the Northeast Valley is either deteriorating or improving only slowly for sellers. Scottsdale managed an improvement of just 3%, but Paradise Valley is down 15% while Fountain Hills and Cave Creek are also moving in favor of buyers. In the Northeast supply is growing although it is declining almost everywhere else.
The middle of the market seems to be most favorably affected by recent trends, with Avondale, Glendale, Phoenix and Goodyear all seeing their CMI increase by 25% or more.
The outer areas such as Buckeye, Maricopa and Surprise are improving for sellers but at a slower rate.
The improving situation for sellers is causing pricing to firm up. However the increase in mortgage rates over the past week may take some of the wind out of those sails.
Feb 8 - Interest rates looked stable during January but they have started misbehaving again in the first week of February.
All looked fine on February 2 when the 30 year fixed rate averaged 5.99%. This was the day AFTER the Federal Reserve increased its benchmark rate by 0.25%. However the average 30 year rate has now jumped up to 6.45% in just 3 days. The FHA 30 year rate has increased from 5.36% to 5.90% over the same period.
The jumbo 30 year rate averaged 6% yesterday, up from 5.65% on February 2. This is not good for home buyers or sellers.
If these rates stick around it will probably apply the brakes to the recovery in demand we experienced in January.
Feb 7 - It seems a bit silly these days to refer to Opendoor and OfferPad as iBuyers. The are still "i" but they are doing very little buying. During January 2023 in Maricopa County they purchased 42 homes, and all but 2 were bought by Opendoor.
Both are actively selling to try to reduce the very large inventory that built up from May 2022. My rough calculations indicate that Opendoor has whittled theirs down from a peak of 2,500 in August to around 1,500 now. This represents 6 to 7 months of supply at their current sales rate, so probably twice as many homes as they would ideally want. OfferPad hit a maximum slightly under 500 in August and are now down to less than 240. This represents only 3 months of inventory if they keep up the monthly sales rate they achieved in January. At 82 sales January was their busiest selling month since May 2022.
There has been no sign of iBuying picking up in February so far, but we can expect the iSelling to grow over the next several months.
Feb 5 - "Reasons to Be Cheerful (Part 3)" - Although closed sales volumes are low and prices are down from this time last year, total dollar volume is higher than it was in February 2020, just 3 years ago. This is because prices are so much higher than they were on 2020. The amount of money buyers are spending on homes listed on ARMLS is greater than it was then (just before COVID-19 took off), so the total amount of commission earned is also greater.
Based on the number of listings under contract, February closed sales should be significantly higher than January. This is a safe bet, because it has happened every year since we started measuring.
Feb 4 - The Affidavits of Value have been processed from Maricopa County for January and we deduce:
There were 4,559 closed sales - down 44% from January 2022
There were 976 new home sales - down 6%
There were 3,583 re-sales - down 49%
The monthly median sales price was $439,000 - down 0.5% from January 2022
The new home median sales price was $503,195 - up 9.4%
The re-sale median sales price was $420,000 - down 4.3%
Clearly new homes are faring much better than re-sales in both volume and pricing.
These numbers are for single-family and townhouse/condo homes combined.
Feb 3 - Here is our latest table of Cromford® Market Index values for the single-family markets in the 17 largest cities

Fountain Hills continues to weaken, but remains in number one position. Paradise Valley has also weakened and dropped to number 3 with Chandler taking its place.
15 out of 17 cities are showing an improved market for sellers. Huge improvements are apparent for Avondale, Chandler, Mesa, Queen Creek, Tempe, Glendale and Phoenix.. The latter is extremely important because Phoenix represents about 25% of the total market in Central Arizona and a 25% gain in its CMI means we are headed towards a significantly improved situation for sellers. Those expecting significant further price reductions will probably be dismayed.
Cave Creek, Scottsdale, Maricopa and Buckeye have seen only modest improvements, but they are all more favorable for sellers than a month ago.
Among the secondary cities, Anthem, El Mirage and Tolleson are doing particularly well while Apache Junction, Sun Lakes and Sun City West are comparatively weak.
The average change in the CMI over the past month is 18%, lower than the 20% that we saw last week. The positive trend is no longer accelerating, but remains substantial.
Among the 17 largest cities we see 4 currently in a buyer's market below 90, 2 balanced between 90 and 110, and 11 in a seller's market over 110.
The improving demand is not limited to the Greater Phoenix area. Yesterday the developer Meritage reported that January 2023 new home orders were 4% higher than January 2022.
Feb 2 - For the single-family detached market, all but 7 ZIP codes showed an increase in listings under contract over the last month. A few lucky areas more than doubled. These were:
Carefree 85377
Gilbert 85296
Gilbert 85297
Glendale 85306
Goodyear 85395
Mesa 85201
Mesa 85210
Peoria 85382
Phoenix 85007
Phoenix 85015
Phoenix 85020
Phoenix 85021
Phoenix 85023
Phoenix 85031
Phoenix 85043
Phoenix 85045
Phoenix 85054
Phoenix 85083
Sun Lakes 85248
Notable exceptions were Scottsdale 85251 and 85257 which both ended January with fewer homes under contract than they started.
Feb 1 - We experienced a huge increase in demand during January, though this was from an extremely low level as of January 1.
The number of listings under contract rose from 5,456 to 7,810 an increase of 43%. This is by a wide margin the highest percentage increase we have ever measured from one month to the next. It shows us that buyers are getting used to interest rates around 6%. It helps a lot when sellers are willing to help them buy down the initial rate.
Pending listings increased almost 40% while UCB listings jumped over 50%.
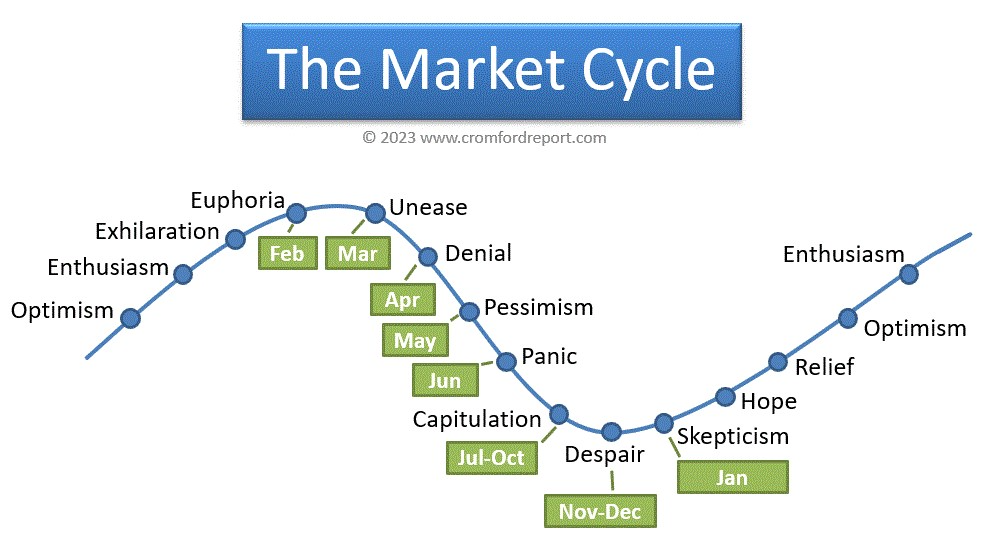
It is time to drop the Skepticism and enter the Hope stage of the cycle. In most market cycles this diagram takes 3 to 5 years to pan out. However we have moved from Euphoria to Hope in just 1 year. I suppose this is the result of the increased speed of communication.
Listings are going under contract so quickly that the supply of new listings cannot keep up, despite a much higher flow of new listings than we saw in December. We are heading back towards a supply-constrained market and it is likely that prices will start to move higher within a short space of time. Asking prices are moving upwards quickly and these are usually a leading indicator.
While there is no guarantee that mortgage rates won't go higher again, 2023 has started out much stronger than anyone expected back in November. This underscores why it is important to track the market daily, not just once a month.
Jan 31 - The latest S&P / Case-Shiller® Home Price Index® numbers were published today.
The new report covers home sales during the period September to November 2022.
Comparing with the previous month's series we see the following changes:
1. New York -0.06%
2. Miami -0.20%
3. Washington -0.29%
4. Detroit -0.43%
5. Atlanta -0.56%
6. Chicago -0.62%
7. Cleveland -0.67%
8. Boston -0.69%
9. Minneapolis -0.72%
10. Charlotte -0.72%
11. Denver -0.84%
12. Los Angeles -0.93%
13. Portland -0.95%
14. Tampa -1.02%
15. Dallas -1.10%
16. San Diego -1.37%
17. Seattle -1.52%
18. San Francisco -1.59%
19. Las Vegas -1.70%
20. Phoenix -1.85%
Phoenix has dropped from 18th to last place and is well below the national average, which was -0.56%.
All 20 cities are in negative territory month to month and the Southeast has started to decline faster, especially Tampa. Once again, New York and Washington were among the top three performers. The Pacific Coast cities continue to be severely affected by the downturn especially the extremely expensive locations of San Francisco and Seattle. Dallas and Las Vegas have also joined them in the bottom 6.
Comparing year over year, we see the following changes:
1. Miami +18.4%
2. Tampa +16.9%
3. Atlanta +12.7%
4. Charlotte +12.6%
5. Dallas +10.9%
6. New York +8.1%
7. Chicago +7.7%
8. Cleveland +7.5%
9. Boston +6.9%
10. Las Vegas +6.6%
11. Phoenix +6.3%
12. Detroit +6.2%
13. Denver +6.1%
14. Washington +5.3%
15. Minneapolis +4.9%
16. San Diego +4.8%
17. Los Angeles +4.4%
18. Portland +4.0%
19. Seattle +1.5%
20. San Francisco -1.6%
San Francisco and Seattle are at the bottom of this table once again, and as predicted San Francisco is the first of the 20 to go negative on a year over year basis.
Phoenix is in 11th place down from 6th last month.
Jan 30 - The monthly average closed price per sq. ft. has been nearly flat since mid December and with the CMI still rising, there seems to be a diminishing likelihood of the average $/SF falling significantly below the current level of $260 to $270 per sq. ft.
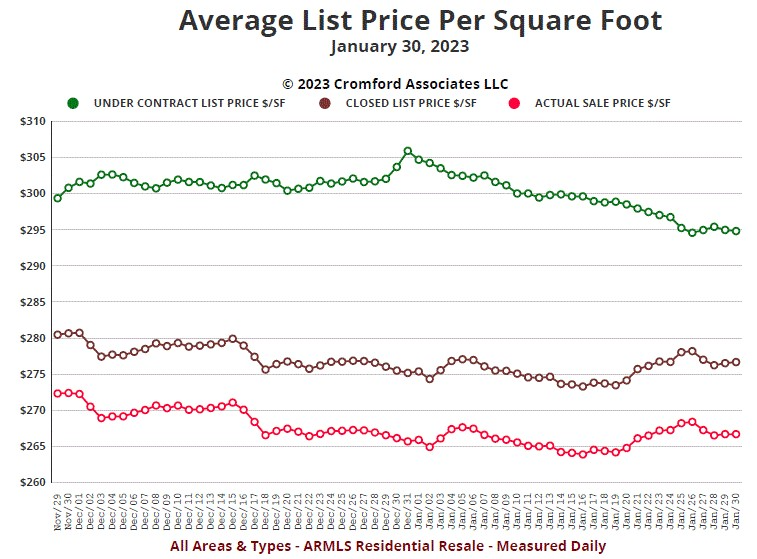
Admittedly the average $/SF for listings under contract has dropped to $295, but it was high at over $300 and the gap between the green and brown lines needed to close sooner or later. In the meantime, the average $/SF for active listings is getting stronger - up a massive 3.7% over the last month. Demand remains low, but noticeably better than last month, while supply remains unusually weak. Significant price drops are almost always accompanied by a sharp rise in supply. This happened in the spring and summer of 2022, but supply is stubbornly low right now. Pundits often pay too much attention to demand and too little attention to supply.
There is no evidence in any of these numbers of the so-called housing price crash that many are still forecasting. If mortgage rates rise dramatically from this point, we could still see a resumption of price declines, but without that our best guess is for closed prices to stabilize and then move higher over the next couple of months. We do not pretend to know what will happen more than 2 months into the future.
Jan 29 - Single-family detached building permits continue to fall in Maricopa and Pinal counties. Only 997 were reported in December, the lowest monthly total since January 2015. The fourth quarter of 2022 produced only 3,536, down from 7,597 a year earlier. It looks like the supply of new single-family homes is going to be very tight during the second half of 2023.
The opposite is true in multi-family and attached homes. Permits for these are hitting new record highs. 3,397 units obtained planning permits in December. This is by far the largest monthly total we have ever seen, the previous record being held by July 2022 at 2,546.
At 5,893, the count for 4Q 2022 was the highest quarterly total ever and exceeded the single-family count by 67%.
These are very unusual number for permits and suggest that the mix of homes built in Greater Phoenix will be much different in the coming year. We are likely to see far fewer detached homes and far more attached homes and apartment blocks. This will help affordability and increase population density, but the single-family detached home which has dominated the residential market for the entire history of Phoenix is starting to lose market share.
Jan 26 - Here is our latest table of Cromford® Market Index values for the single-family markets in the 17 largest cities
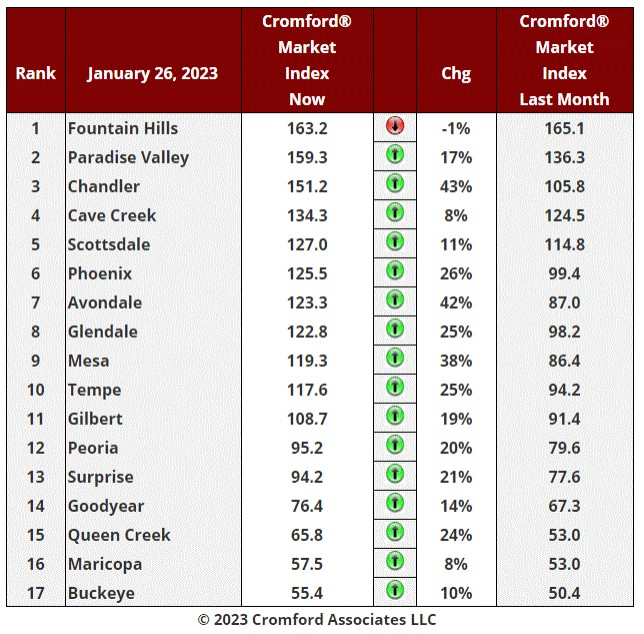
I mentioned last week that Fountain Hills was beginning to weaken. It is now lower than last month by 1%, but this did not stop it reclaiming the top spot. This is because Paradise Valley has also weakened over the past in the last week and by a larger amount. The high-end of the market is not participating very strongly in the increased demand that we are seeing for the mid-range and low-end. Cave Creek has also retreated in the past week. Scottsdale continues to increase but at a reduced speed.
The Southeast Valley is having a spectacular CMI recovery with Chandler up 43%, Mesa up 38%, Tempe up 25%, Queen Creek up 24% and Gilbert up 19%. Phoenix is also strong at 26% and the inner West Valley too, with Glendale up 25%, Avondale up 42%, Peoria up 20% and Surprise up 21%. Outer areas such as Buckeye and Maricopa are still improving for sellers, but more slowly.
The average change in the CMI over the past month is 20%, lower than the 22%that we saw last week.
Among the 17 largest cities we see 4 currently in a buyer's market below 90, 3 balanced between 90 and 110, and 10 in a seller's market over 110.
Among the secondary cities, Sun Lakes looks very weak with unusually low demand, and Apache Junction and Arizona City have lost momentum.
Overall the market is more favorable to sellers than we expected in December and downward pressure on pricing has been largely eliminated, except in a few market segments.
The more favorable situation has started to bring more sellers into the market and new listings have been more plentiful over the last week. Overall supply remains well below normal and so does demand. Volume is low bur it is increasing and market health is improving, not deteriorating as it was for much of 2022.
Jan 25 - There is a story run by Fox Business News today that quotes Goldman Sachs making all kinds of weird and unlikely forecasts. Not quite sure how to deal with it because its description of the current Phoenix market bears little comparison with the real world.
Some quotes are:
Goldman Sachs expects home values to worsen through 2023 amid continued skyrocketing interest rates and declining housing prices
four US cities will suffer the most catastrophic dips, drawing comparisons to the 2008 housing crash
Phoenix Arizona will likely see noticeable increase before drastic decreases of more than 25%
My comments are:
We saw skyrocketing interest rates in 2Q and 4Q of last year. The idea that interest rates will skyrocket in 2023 seems more than a little far-fetched when the inflation rate is falling. It could happen, but to have this as your base case seems very irresponsible.
Is Goldman Sachs really saying Phoenix home prices will go up and then drastically down? Come on now, there is no data that supports that outlook. Just a wild-ass guess?
In the Great Recession, the median price in Phoenix declined from a peak of $265,000 in June 2006 to a low of $109,000 in May 2011. That is a fall of almost 60%.
Please let us not compare 60% with 25%. They are not similar.
Since the peak in May 2022 of $475,000, the median was down to $412,000 by December. This is a fall of 13% so far.
The lack of coherent thinking in the text of the article contrasts with the interview with Ara Hovnanian that appears on the same web page. I went away with the impression that Ara Hovnanian has his head screwed on tight and that the Goldman Sachs housing analyst has lost the plot. Maybe Sky Business garbled the message that Goldman Sachs put out?
Also confusing are Goldman Sachs recent forecasts of interest rates:
November - mortgage rates will drop to 5% by March and property values will rise 1.8%
December - 6.2% average rate for 2023
January - 6.5% by 2023 year end (not sure how skyrocketing takes place in this context)
No-one has ever been very good at forecasting mortgage interest rates more than a couple of weeks in advance. This includes the Mortgage Bankers Association and it especially includes Goldman Sachs whose track-record on interest rate forecasts is extremely poor. This is not saying much because there is no-one who gets them right more than by random chance.
Any time spent listening to people making interest rate forecasts is time you could have spent more productively.
Jan 24 - "Reasons to Be Cheerful" (Part 2)

The contract ratio on Saturday was 41.9 (for Greater Phoenix single family, townhouse/condo & mobile homes). This is the highest value since early September and tells us that the market is warming up, despite it being much cooler than this time last year.
Purchase mortgage applications are growing very fast and it looks as though the spring buying season will be better than we dared hope when gazing into the future last November.
Jan 21 - "Reasons to Be Cheerful" (Part 1)
The count of listings under contract has increased by 22% over the last 2 weeks. This is the highest percentage growth we have ever measured for week 3 over week 1.
Demand is taking off.
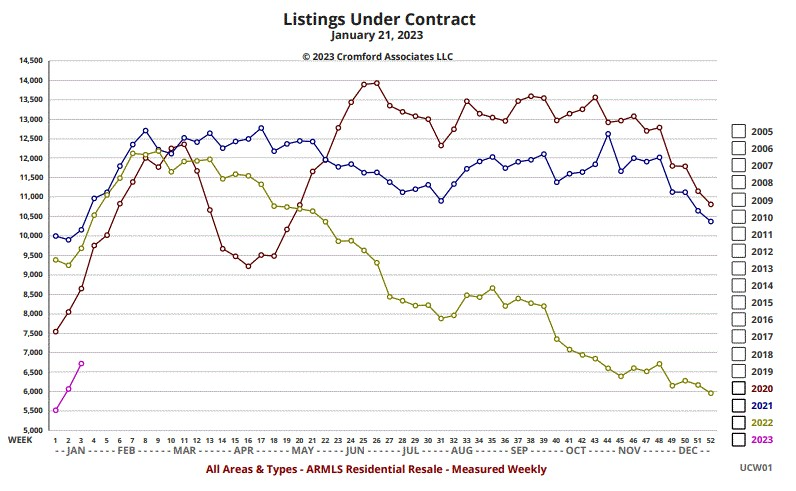
Jan 19 - Here is our latest table of Cromford® Market Index values for the single-family markets in the 17 largest cities

As you can tell from all the green signals, this has been another week in which the balance in the market moved strongly in favor of sellers. The average change in the CMI over the past month is 22%, the same as last week.
Paradise Valley has moved ahead of Fountain Hills, which is beginning to weaken.
Fastest movers over the last month are Chandler (up to third place) Avondale and Mesa.
At 20% or above we have Peoria, Phoenix, Queen Creek, Tempe and Glendale, while Gilbert, Cave Creek, Scottsdale, and Surprise are above 10%.
Fountain Hills, Buckeye, Maricopa and Goodyear are below 10%.
Among the 17 largest cities we see 4 currently in a buyer's market below 90, 4 balanced between 90 and 110, and 9 in a seller's market over 110.
Among the secondary cities, Sun Lakes looks very weak with unusually low demand, but Anthem, El Mirage and Litchfield Park are strengthening quickly.
Jan 16 - Buyers seem to like the new mortgage rates. Since January 5 there has been a sharp up-tick in the pace of contracts being signed and some attractive well-priced homes are receiving multiple offers.
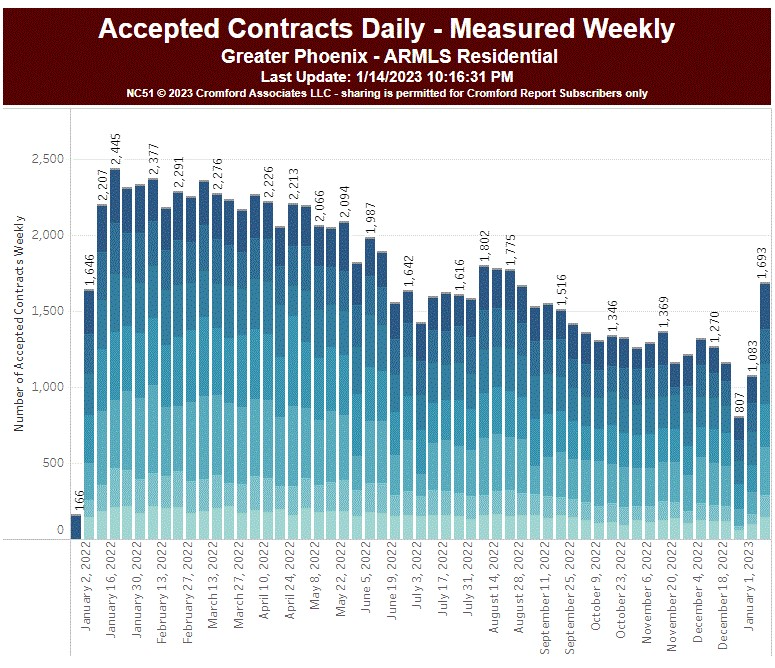
The second week of January was the strongest week since mid-August, another time when mortgages rates moved lower, albeit only temporarily.
If this trend in buyer demand continues, it is likely to halt price declines. This is already being seen in the average $/SF for active listings, which is showing an upward trend. It will then spread to under contract listings and eventually to closed listings. The latter is very much a trailing indicator so it might be Q2 before we see that signal.
Of course, if mortgage rates climb higher again, all bets are off.
Jan 15 - Although prices have fallen back over the last 9 months, the annual average price per square foot is still substantially higher than it was this time last year. This is not surprising given how far prices rose in 2021
The top performing cities based on comparing the annual average $/SF with the same measure 12 months ago are:
Carefree - up 25.5%
Paradise Valley - up 24.7%
Fountain Hills - up 24.4%
Coolidge - up 23.4%
Wickenburg - up 23.2%
Cave Creek - up 22.2%
Scottsdale - up 21.7%
Youngtown - up 21.2%
Gold Canyon - up 20.0%
Avondale - up 19.9%
The bottom of the table looks like this:
Maricopa - up 16.0%
Waddell - up 15.7%
Sun City - up 15.5%
Eloy - up 14.5%
Tempe - up 13.9%
All the other non-trivial cities are up between 16% and 20%.
It is noticeable that the top performing table is dominated by the most expensive areas of the Northeast Valley, but appearing in that top 10 at number 4 is also the cheapest area of all - Coolidge, far out to the southeast in Pinal County.
Jan 14 - Some mortgage rates have dropped sharply since the beginning of the year. According to MND:
the 30 year fixed rate has fallen from 6.54% to 6.09%
the 15 year fixed rate has dropped from 5.87% to 5.27%
the 30 year FHA rate has dropped from 6.15% to 5.65%
the 30 year VA rate has fallen from 6.20% to 5.72%
These are significant declines which explain why we are seeing a big pick up in contract acceptances, especially during the last 7 days.
However, some other rates have not fallen much at all:
the 30 year JUMBO fixed rate is unchanged at 5.70%
the 5/1 ARM rate has only fallen modestly from 6.20% to 6.03%
This means the increase in demand is going to be a bit patchy unless and until all loan types follow suit and drop to 6% or below.
Jan 13 - We reported yesterday that the 17 largest cities are now all moving in favor of sellers. The last hold out - Goodyear - changed direction on December 26
Looking at the secondary cities, we still have a handful of cities moving in favor of buyers. These are Arizona City, Laveen and Sun Lakes. The latter's difficulty is surprising given that its main neighbor Chandler is one of the fastest movers in favor of sellers at the moment.
To compensate for these 3, we have 3 secondary cities that are moving very quickly in favor of sellers. These three are Apache Junction, Anthem and Litchfield Park.
Jan 12 - Here is our latest table of Cromford® Market Index values for the single-family markets in the 17 largest cities

This has been another week in which the balance in the market moved strongly in favor of sellers. The average change in the CMI over the past month is 22%, up from 21% last week.
Paradise Valley continues to improve for sellers at a rapid rate. Its supply index is down from 52.1 to 43.2 and its demand index is up from 57.6 to 73.2. So demand is still well below normal, but supply is below normal to a far greater degree. Surprisingly, the average $/SF in PV is already starting to rise, across active, under contract and even closed listings.
Also improving fast for sellers are Chandler, Mesa, Avondale - all up 39% or more for the last month. These are leading the charge.
Above 20%, we have Phoenix, Tempe and Glendale, while Peoria, Gilbert, Cave Creek, Queen Creek, Surprise, Fountain Hills and Buckeye are above 10%.
Scottsdale, Maricopa and Goodyear are below 10% but all improving, unlike last week when Goodyear was still going backwards.
Remember that the Cromford® Market Index is the earliest of leading indicators. It tends to go down before most people expect it to and it goes back up before people think it should. It can be up to a month before other market indicators follow suit. For example, last year it peaked on February 7 and started to weaken. During the bubble years, it reached an all time low of 26.5 on November 6, 2007 and then rose very slowly over the following 2 years, not exceeding 100 until May 2009.
Among the 17 largest cities we see 6 currently in a buyer's market below 90, 4 balanced between 90 and 110, and 7 in a seller's market over 110.
Loan officers nationwide report that new mortgage applications are rising in volume. This could have something to do with the fact that typical 30 year fixed mortgage rates have dropped by 0.5% since the start of the year.
The time may soon come to replace skepticism with hope. Despair is so 2022, and no longer fashionable.
Jan 11 - In another positive sign for the market, the contract ratio for all areas & types has risen from 33.5 on January 1 to 36.9 on January 11. These are both small numbers when compared with 12 months ago, when the contract ratio rose from 162.6 to 172.0. However in percentage terms, the growth in 2023 (over 10%) is greater than that in 2022 (under 6%). Though the market is dramatically cooler than last January, it is warming up.
At this stage in the market cycle, where we are just emerging from despair, all positive signs will be greeted with generous amounts of cynicism. We recommend eliminating all emotions and just focusing on the numbers.
If the contract ratio continues to improve at a decent rate, then we should eventually see sales volumes start to recover. If it languishes below 40 then our expectation for volumes will remain modest.
For those willing to believe, the average price per square foot for active listings is up to $329.25 today. This is the highest $/SF since July 31 and is usually a leading indicator of greater sales pricing strength. The low point for this particular measurement was $319.77 on September 18. The trend since September has been upwards, despite the opposite trend in closed listing $/SF. These two trends cannot go in opposite directions over a very long period. Either active pricing will have to decline once again or sales pricing will have to start recovering some of the ground it has lost over the past 8 months. The latter outcome looks slightly more likely unless mortgage rates rise significantly from their current levels. Do not expect average sales $/SF to turn around immediately however. The process is forming a bottom is usually a slow one, often taking several months while confidence rebuilds.
Jan 8 - Looking further into the Maricopa County affidavits of value filed during December we find the following:
New construction closings were 1,698 - down 8% compared to December 2021
Re-sales outside the MLS (FSBOs) were 539 - down 65%
Re-sales through the MLS were 3,057 - down 50%
iBuyer sales were 244 - down 66%
iBuyer sales by OfferPad were 31 - down 73%
iBuyer sales by Opendoor were 205 - down 50%
iBuyer sales by Redfin were 8 - up 14%
iBuyer purchases were 86 - down 79%
Institutional investor purchases were 91 - down 88%
Distressed sales (pre-foreclosures) were 46 - up 31%
Sales by wholesalers were 72 - down 45%
Fix & flip sales were 300 - down 50%
Fix & flip purchases were 228 - down 52%
Foreclosure auction sales were 19 - down 17%
Bank owned sales were 2 - down 33%
GSE owned sales were 3 - down 50%
In market-share terms, there has been a large swing towards new construction sales and away from re-sales, especially iBuyer re- sales. FSBO sales are down by a largest percentage.
Institutional investors have dramatically reduced their purchases over the last 12 months.
Allowing for the number of working days in the month, there were 280 closings per working day, down 46% from December 2021.
Jan 6 - Here is our latest table of Cromford® Market Index values for the single-family markets in the 17 largest cities
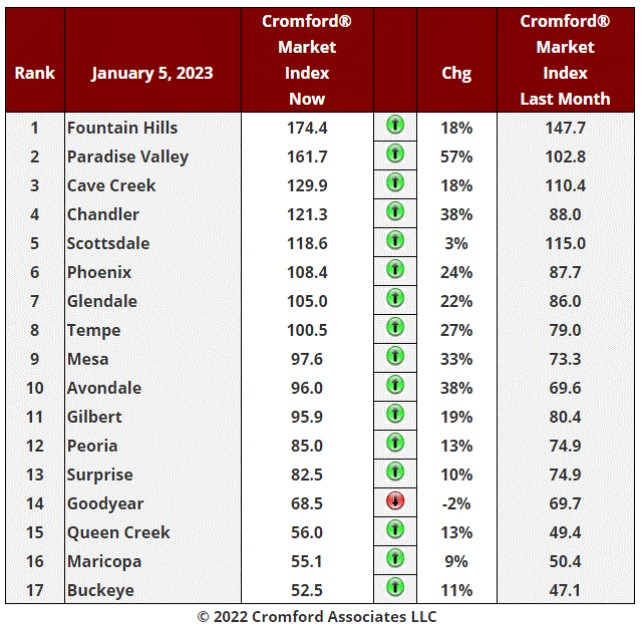
The balance in the market continues to move strongly in favor of sellers. The average change in the CMI over the past month is 21%, up from 16.3% last week.
Paradise Valley is improving for sellers as an astonishing pace, with supply dropping and demand rising. Not far behind are Avondale, Chandler and Mesa, all up more than 30% over the past month.
Even though Goodyear is very late to the party, it has started to head higher within the last 2 weeks. To find a location that is still moving in favor of buyers we have to look among the secondary cities, where we find Sun Lakes, Laveen and Arizona City.
Among the 17 largest cities we see 6 currently in a buyer's market below 90, 6 balanced between 90 and 110, and 5 in a seller's market over 100.
Four of the top five locations are all fairly expensive, but averagely-priced Chandler is also a seller's market and Phoenix and Glendale look like they will soon be in the same situation.
Confidence could be making a comeback sooner than expected.
Jan 5 - The affidavits of value for Maricopa County have been analyzed and tell us the following about December 2022 closings:
Overall closed transactions totaled 5,758, down 46% from December 2021
Overall median sales price was $450,000, up 4% from December 2021
Re-sale closed transactions totaled 4,073, down 54% from December 2021
Re-sale median sales price was $420,000, down 3.3% from December 2021
Newly built closed transactions totaled 1,685, down only 6% from December 2021
Newly built median sales price was $521,555, up 17% from December 2021
The gap between the re-sale and newly built numbers continues to grow. The new home market is far more healthy than the re-sale market both in volume and in pricing. Since the majority of new homes are NOT listed on the MLS, our statistics based on ARMLS data reflect a much more negative picture than is being experienced by the new home developers. They are still seeing median prices that are 17% higher than a year ago, whereas re-sale median prices are lower than last year at this time. Many re-sale agents are probably not aware of how much better the new home market is performing, compared to the re-sale they are experiencing.
New homes now represent over 29% of the market. This is the highest market share since 2008.
Jan 4 - The excessive inventory held by iBuyers has reduced over the past 6 months but remains higher than they would wish. Here are the ARMLS listing counts for Opendoor:
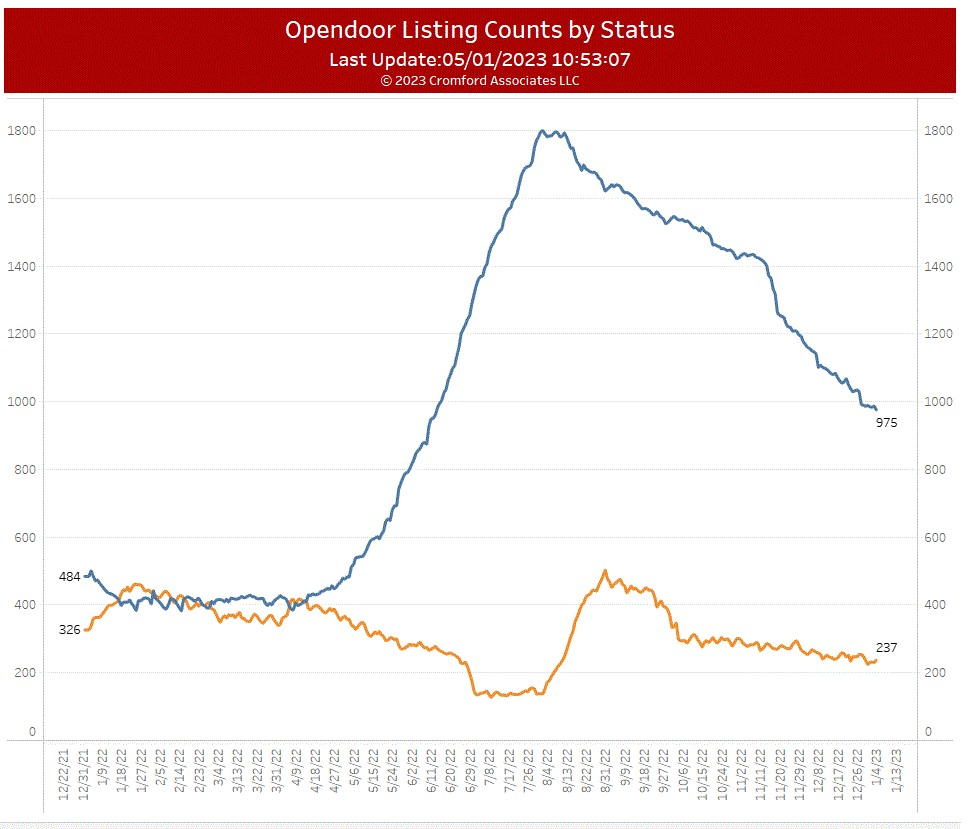
The contract ratio is 24, which is worse than the overall market at 34, but a big improvement over the July figure of around 10. They would probably need to see active counts below 500 to feel inventory was balanced with demand, given their monthly sales number for December was around 230. They purchased about 90 homes in December, less than a third of their acquisition total in December 2021.
Jan 2 - The Cromford® Market Index for all areas & types spent very little time in the buyer's market zone below 90:

Between November 15 and December 11, the CMI was below 90, but during the last three weeks it has shown strong signs of recovery and is almost back over 100 again. This means statistical downward pressure on prices is negligible and the only reason for prices to go down after January are psychological. We are likely to see plenty of skepticism, but gradually people will realize that things are not so bad. Of course, the Federal Reserve can still kick us some more, but we will not try to predict the effect that will have on mortgage rates.
We are back in a very normal market from the point of view of the balance between buyers and sellers. We are still very far from normal in terms of volumes. We have very few buyers and very few sellers, so transaction counts are unusually weak. This will not feel good for those who depend on volume, but once confidence returns, volume will probably start to recover.
Dec 29 - Here is our latest table of Cromford® Market Index values for the single-family markets in the 17 largest cities

Just look at all that green.
This table is quite startling - the market balance is now swinging quickly towards sellers, yet this does not seem to be reflected in market commentary in the general media. This shows the advantage of measuring the housing market every day, rather than once a month. One month ago, the situation looked bleak for sellers. The average CMI has fallen by -4.3% in the month prior to December 1.
Today we see an average CMI improvement of +16.3%.
It is not just that supply has been falling rapidly, we are now seeing stronger demand. It being December, this may easily go unnoticed by those not paying close attention, but the numbers do not lie. Relative to November, December's demand numbers are improving. If this trend rolls over into January and continues, we could see a much more positive picture during the first quarter than we expect just 3 weeks ago.
The swing in favor of sellers is most noticeable in Paradise Valley, Avondale, Chandler, Tempe, Mesa, Glendale, Gilbert and Phoenix. Only Goodyear has yet to get with the program. Scottsdale is late to the party but is starting to swing over the last week.
We now have 5 cities in the seller's market zone over 110, 5 cities in the balanced zone between 90 and 110 and 7 in the buyer's market zone under 90.
Dec 27 - The latest S&P / Case-Shiller® Home Price Index® numbers were published today.
The new report covers home sales during the period August to October 2022. This means they now fully reflect the weakening in the market during the last 5 months.
Comparing with the previous month's series we see the following changes:
New York -0.17%
Chicago -0.50%
Washington -0.54%
Los Angeles -0.63%
Minneapolis -0.67%
San Diego -0.69%
Tampa -0.77%
Atlanta -0.77%
Portland -0.88%
Charlotte -0.89%
Detroit -0.92%
Miami -0.96%
Boston -0.98%
Cleveland -1.01%
Seattle -1.02%
Denver - 1.09%
Dallas -1.27%
Phoenix -1.55%
San Francisco -1.66%
Las Vegas -1.76%
Phoenix has dropped from 17th to 18th place and well below the national average, which was -0.53%.
All 20 cities are in negative territory month to month and the Southeast has started to decline faster. It is a very long time since New York and Washington were among the top three performers. The Pacific Coast cities continue to be severely affected by the downturn especially the extremely expensive locations of San Francisco and Seattle. Dallas, Denver and Las Vegas have also joined them in the bottom 5.
Comparing year over year, we see the following changes:
Miami +21.0%
Tampa +20.5%
Dallas +13.5%
Charlotte +15.0%
Atlanta +14.9%
Phoenix +9.6%
Las Vegas +9.4%
New York +9.3%
Chicago +8.9%
Cleveland +8.7%
Denver +7.9%
Boston +7.7%
San Diego +7.5%
Detroit +7.0%
Los Angeles +6.6%
Washington +6.0%
Minneapolis +5.9%
Portland +5.4%
Seattle +4.5%
San Francisco +0.62%
San Francisco and Seattle are at the bottom of this table once again, and it looks as though San Francisco will be the first of the 20 to go negative on a year over year basis.
Phoenix is in 6th place, one spot higher than last month.
Dec 24 - Active listing counts have been dropping fast, despite the low demand, but Coming Soon counts have increased over the past week. Having reached a low point of 323 on December 16, they are up to 478 today, the highest count since November 9.
This is probably not an indication of a flood of new listings coming after Christmas. Although the increase is big in percentage terms (48%) the absolute number of Coming Soon listings is small relative to the total number of Active Listings. It is also less than half the number of Coming Soon listings we saw back in April and May.
A similar effect occurred in the week before Thanksgiving. This is probably agents entering a listing before the holidays for sellers who do not want to show the home during their family together-time. Not statistically important, just a side-effect of normal human behavior.
Dec 22 - Here is our latest table of Cromford® Market Index values for the single-family markets in the 17 largest cities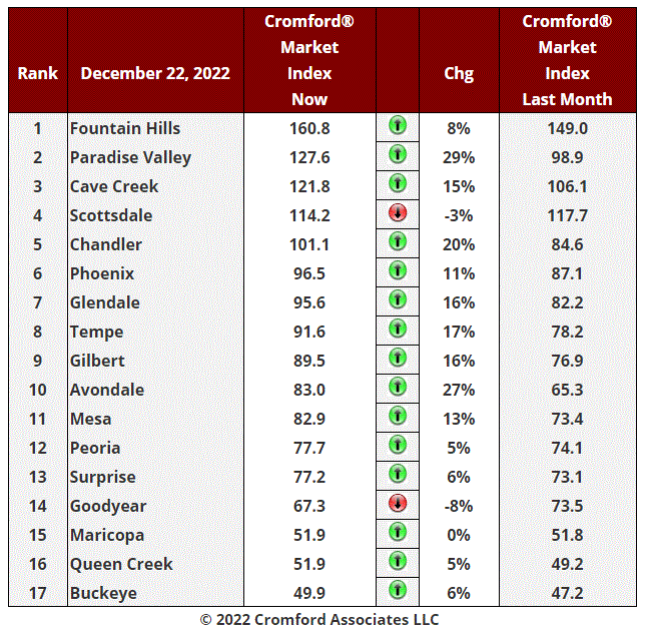
This table is telling that the market is improving rapidly now, at least in terms of the balance between sellers and buyers. We now have 15 cities showing improvement for sellers over the past months and only 2 still deteriorating. Those 2 are Scottsdale and Goodyear.
The average change in CMI over the last month is +10.7%, a huge improvement over +5.3% last week.
This change is happening because new supply is collapsing. There have been only 4,875 new listings added in the last 4 weeks. This time last year we had over 7,000.
At the same time, demand is showing signs of life as buyers realize that they don't much like interest rates around 6% but they like them a whole lot more than over 7%. Sellers are also increasingly willing to help with rate buy-downs to make that initial hurdle easier to jump.
The bad news is that transaction volume remains very low. If you are hoping for much larger volumes, as many are, you will have to wait longer. However, it is clear that supply is dropping while demand is rising. That is usually welcome news, even though many people will be slow to believe it. Remember that the market cycle tells us what emotion follows despair - it is skepticism.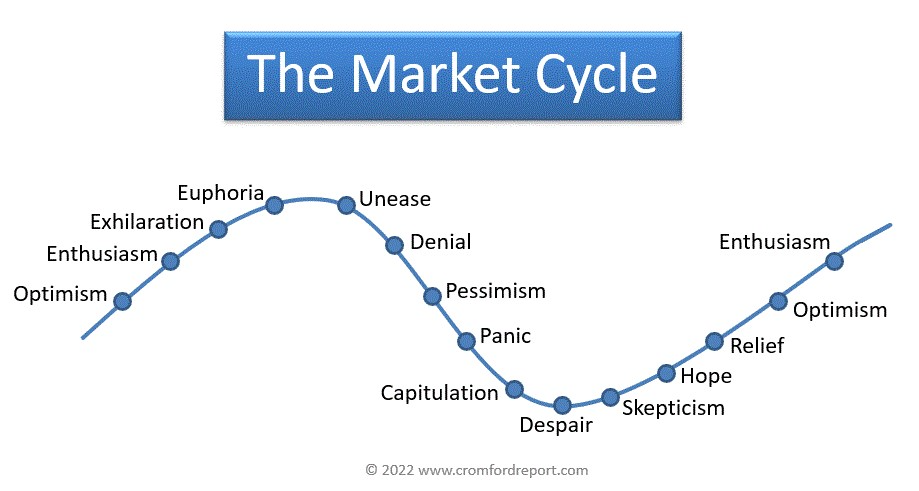
Dec 19 - Are prices back to where they were a year ago?
Well if you are a fan of the monthly median sales price, home prices are lower now than they were this time last year: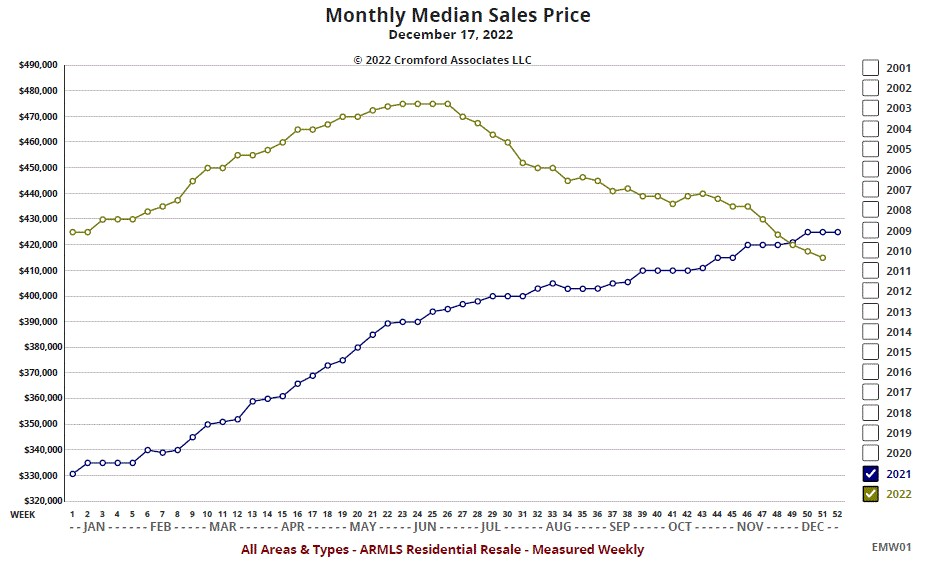
This is also an understatement of the change since seller concessions to buyers are not included in the sales prices and these concessions are much larger now than they were twelve months ago. The median concession amount today is $9,000, which is approximately $6,000 more than in December 2021.
However the situation looks a little less negative if we use average price per square foot to make the comparison: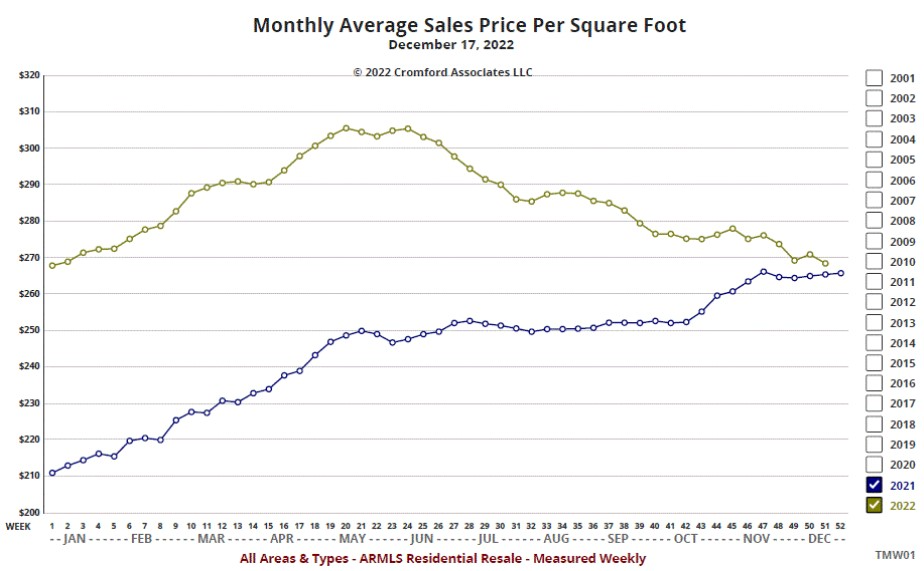
Now we see that the monthly average $/SF is still slightly higher than last year. However our comments about concession still apply, so effectively we are seeing parity between December 2021 and December 2022.
Dec 17 - Below is a chart taken from Tina's latest market update Powerpoint file, available in the download section.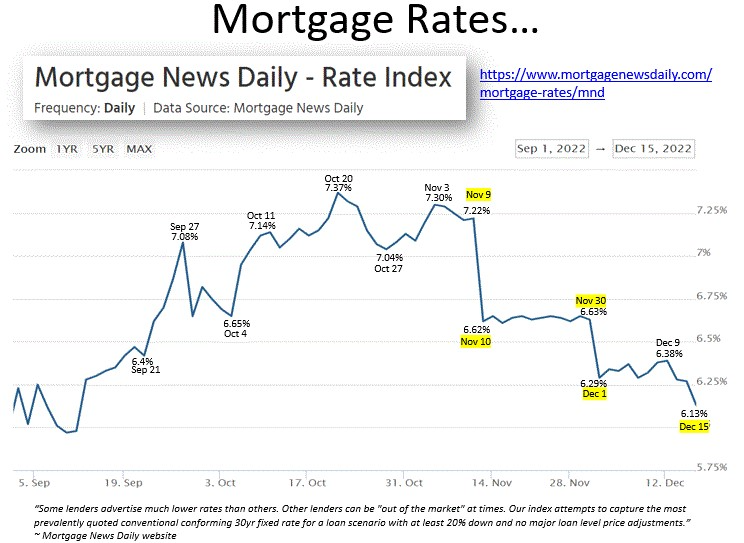
The data is taken from Mortgage News Daily, which is a recommended source for US interest rates monitored on a daily basis.
We can see that interest rates are back down to the low 6's, where they were in early September. Demand did not like rates above 7%, but the low 6s are actually lower than the long-term average and should therefore not be a severe deterrent to home purchase once the fear of losing equity has been eliminated. We admit it does seem high relative to the last decade and results in low affordability given today's median household income and median home price. However, if you were buying a home any time between 1970 and 2001 a rate of 6.13% would be a real bargain. Most of the time during those years, mortgage interest rates were over 8%.
Dec 15 - Here is our latest table of Cromford® Market Index values for the single-family markets in the 17 largest cities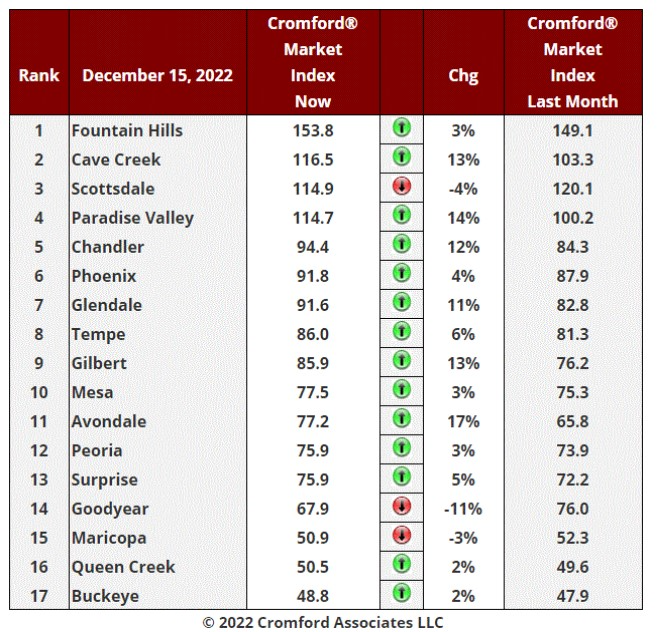
It has been a good week for optimists. We now have 14 cities showing improvement for sellers over the past months and only 3 still deteriorating. Those 3 are Scottsdale, Goodyear and Maricopa. Maricopa has reversed this trend and started moving up over the past week while Goodyear and Scottsdale are still deteriorating.
The average change in CMI over the last month is +5.3%, a huge improvement over the last few months
Most of this improving trend is due to declining supply, which in turn is caused by the very low arrival rate of new listings. Demand remains pretty weak, but is starting to show a few signs of life now that mortgage rates have dropped well below the peak reached in November.
10 of the cities remain in the buyer's market zone below 90, but Glendale, Chandler and importantly, Phoenix are all in the balanced zone between 90 and 110. 4 cities are seller's markets.
This is table to bring a morsel of seasonal joy to market observers.
Dec 14 - Sales prices have declined significantly over the past 6 months and pricing levels right now are roughly similar to December last year.
Prices climbed for the first half of the year, though the first quarter was far more positive than the second. For those who want the most negative picture, it would be best to compare prices now with those six months ago. Here are the monthly median sale prices for December 13 compared with June 13 and also with December 13, 2021.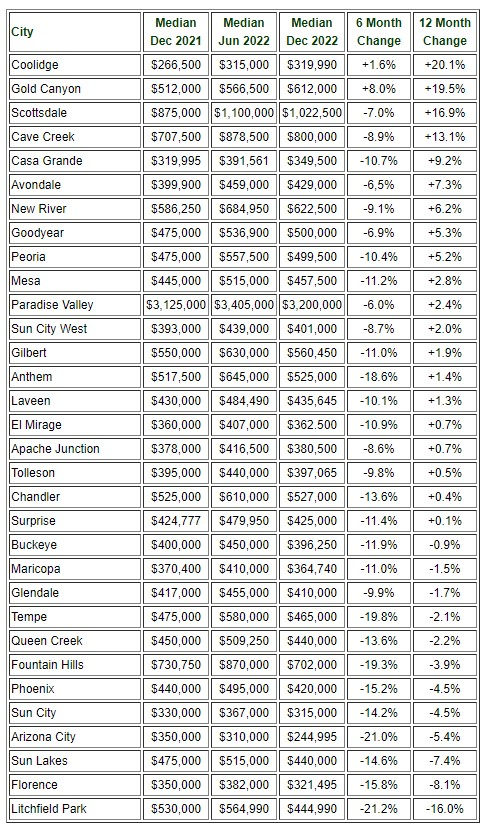
We should remember than monthly medians can be quite volatile, particularly for areas with low sales counts. The highest closing volumes are for Phoenix, with roughly 25% of all sales in Central Arizona. So the numbers for Phoenix carry the highest confidence and lowest volatility. Phoenix shows us prices that have fallen 15% since June and are now down 4.5% from this time last year.
Dec 13 - The Cromford® Market Index for all areas & types has risen from the high eighties to over 90 as of today, so we are now declaring a balanced market again. The buyer's market is a relatively rare thing over the long term and our stay in buyer's market territory lasted less than a month - from November 15 to December 12.
The Demand Index is still dropping - it reached 70.9 today, its lowest level since April 2008. However, the Supply Index is falling even faster - it stands at 78.7 and peaked a month ago at 82.8.
The gap between supply and demand is closing and we expect to head closer to the balanced CMI of 100 over the next 3 weeks.
December 2022 Market Report
One-by-One, Most Cities in Greater Phoenix Succumb to a Buyer’s Market
44% of October Sales Involve Seller Paid Concessions to Buyer
For Buyers:
Buyer demand has been more reactive to mortgage rates than normal, but that’s to be expected at the rate of increase we’ve seen this year. In terms of affordability in Greater Phoenix, a household making the median family income should normally be able to afford 60-75% of what’s sold. That measure for the 2nd and 3rd quarters of 2022 was only 22%. Some believe it would take years for affordability to return to a normal range unless sales prices drop dramatically, but that’s not necessarily true. As rising mortgage rates have quickly pushed affordability down, declining mortgage rates can quickly push it back up.
Affordability is determined on 3 things: family income, 30-yr mortgage rates, and sales price. Price is not the only factor that needs to change in order to push affordability back to a normal state. For example, in order for the current median sales price of $418,000 to be considered affordable to a family making the median income of $88,800 in 2021, mortgage rates would have to drop to 3.35%. Or, the median income would have to increase to $119,000 per year. Both of those scenarios are too extreme to expect in a short amount of time. However, it’s reasonable to believe they will meet somewhere in the middle in 2023.
HUD will not release updated income measures for 2022 until May 2023*. However according to the AZ Department of Economic Opportunity, year-over-year wage income has shown a 5-8% increase each month through October. If we estimate a total 7% increase in median family income, that results in a median of $95,000 per year. With 10% down, that puts a family’s budgeted purchase price of a home around: $335,000 at a 6.3% rate, $368,000 at 5.3%, and $406,000 at 4.3%.
From this example, we can see that mortgage rates have a stronger chance of reversing affordability issues faster than any other factor and can mean the difference between a 20% drop in prices and a mere 3% drop. The only experts who can accurately predict the direction of sales prices are those who can accurately predict mortgage rates. However at this stage, mortgage rates are still volatile and most predictions have been flat out wrong.
If rates rise, prices will have to drop more to reach optimum affordability. If they drop, prices will not have to drop nearly as much. The best advice for buyers is to stay engaged with where rates are on a daily basis, and be fully educated on lender programs and seller incentives available so that they can be the first to act when the property and the payment is right for them.
For Sellers:
Welcome to an official Buyer Market in Greater Phoenix, albeit a weak one, for the first time since 2010. As expected, the city of Phoenix finally succumbed to a Buyer Market mid-November, thus classifying the entire market as such. (The northeast cities of Paradise Valley, Scottsdale, Fountain Hills and Cave Creek are all still either Balanced Markets or mild Seller Markets.) While market indicators were plummeting from an extreme Seller Market to Balance between March and June, the trip from Balance to a Buyer Market from July to December has been more like a gentle glide.
Price responses didn’t wait for the official calling, median sale prices began showing a decline after May and as of this date are down 12%, essentially erasing appreciation gained since November 2021 and resulting in a 1.6% negative year-over-year median change.
From here on out, expect reports of negative annual appreciation rates every month as each measure will now be compared to the first half of 2022 price measures.
Moving into 2023, even if mortgage rates stay the same, it is expected that contract activity will increase seasonally as it does every year. Rate buy-downs will remain a key factor in buyer incentives unless rates decline. However, after a long 4th quarter sellers should be able to enjoy more traffic, fewer days on market, and serious buyers in the first half of 2023.
Generally speaking, neither sellers nor buyers prefer to engage in real estate during times of uncertainty. Dramatic fluctuations in mortgage rates combined with insecurities surrounding inflation and unemployment have pressed pause on housing decisions for many sellers and buyers alike, for now. If mortgage rates drop, they’ll get off the fence.
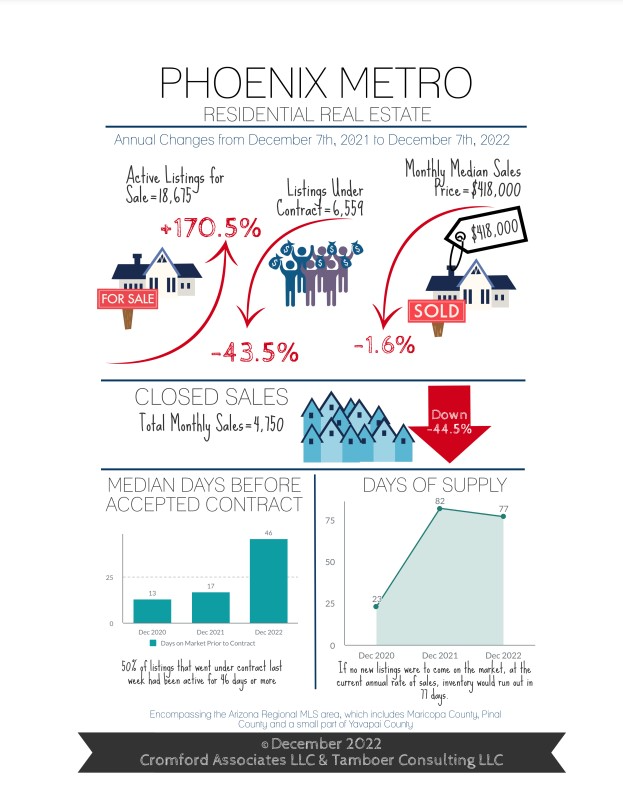
Here is what has actually happened over the past 2 years:
Dec 10 - We have an extremely low number of new listings being added to the ARMLS database. In the chart below we compare the first week of December with previous years: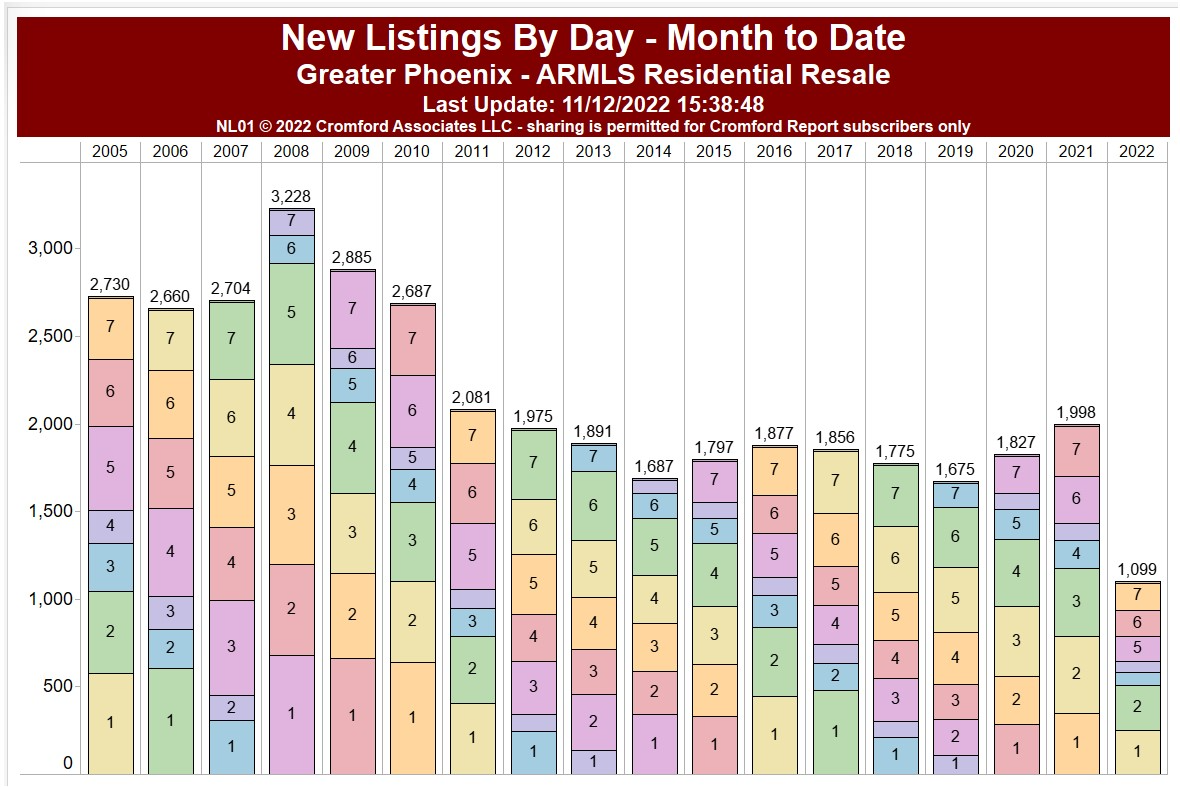
Like 2022, we had a very hot market turn cold in 2005. In the first week of December 2005, we had a total of 2,730 new listings added to ARMLS. Yet In 2022 we have seen just 1,099.
This is down so much, that total supply is dropping quickly even though demand is at an extremely low level. New listings are down 45% from this time last year. This is something we have not seen before. There are remarkably few buyers and even fewer new sellers. We are likely to see more of both once 2023 gets underway, but the mystery is which will grow fastest? There are few clues offered in this month's numbers, but it would reasonable to expect that the recent downward trend in mortgage interest rates is likely to cause both supply and demand to slowly recover.
Dec 8 - Here is our latest table of Cromford® Market Index values for the single-family markets in the 17 largest cities
We now have 7 cities that have improved for sellers over the past month. Chandler, Peoria and Avondale being the latest to join this group.
Over the past week, most cities have seen increases in their CMI, including:
Anthem
Apache Junction
Arizona City
Avondale
Buckeye
Casa Grande
Cave Creek
Chandler
El Mirage
Gilbert
Glendale
Gold Canyon
Laveen
Litchfield Park
Mesa
Paradise Valley
Peoria
Phoenix
Queen Creek
Sun City West
Sun Lakes
Surprise
Tempe
The only cities to decline during the past week have been:
Fountain Hills
Goodyear
Maricopa
Scottsdale
Tolleson
We can safely say that this trend is due to declining supply. Demand remains weak, but with many interest rates down as much as 0.75% from their peak some optimism can be justified that demand is establishing a base and could rise once again in the new year.
Dec 7 - Looking at the Maricopa County recordings for November we see huge reductions in buying activity from the iBuyers and Institutional Investors.
iBuyers purchased only 72 homes in Maricopa County between them, representing 1.3% of the transactions, their lowest market share since July 2020 when they paused activity due to COVID. Opendoor accounted for most of the purchases with 67, while OfferPad bought just 5 homes. OfferPad is down 95% from November 2021 while Opendoor is down 80%. Other iBuyers have ceased their buying operation completely.
In fact, iBuyers might be better named iSellers since they sold 293 homes in November, over 4 times as many as they bought. This is 5.3% of the market, not far below the 5.8% share they had one year ago.
Institutional investors bough 163 homes which is 3% of the market. This compares with 659 purchased in November 2021 which represented 6.3% market share.
Dec 6 - We have commented on rental asking prices getting weaker over the past year, and it now appears that achieved rents are falling too. The latest monthly average rent on the leases closed through ARMLS is $1.30 per sq. ft. per month. The peak was $1.40 measured at the end of August, so we have seen a 7% decline in just 3 months. A year ago we measured $1.34.
Our findings are mirrored in national reports that indicate rents are softening in many geographic areas.
However the sample size for ARMLS data is not huge (typically 2,000 to 2,500 leased closed per month) and the data is a little volatile, so this is more of an indication of weakness rather than an accurate measure of the size of it. Apartment List is quoted saying they expect rents to continue to dip further in coming months and we have no reason to disagree with them.
Dec 5 - The Cromford® Market Index has stopped falling and currently stands between 88 and 89 indicating a mild buyer's market. Demand is lower than supply but supply is falling rather than growing as it is does in most weak markets. Both buyers and sellers have low motivation and general sentiment is poor too. However the fact that we are not seeing escalating supply is much more positive than the situation we faced at the end of 2005 and throughout the period 2006 to 1Q 2009.
Many signs are weak but not unusually so. For example, across all areas and types:
the listing success rate is around 62%, below the long term average of 67.5%, but not excessively low
the contract ratio stands at 32.7, well below average (70) but far above the low of 7 that we witnessed in 2007. We are at a similar level to 4Q 2014
The main issue participants face is a chronic lack of volume: few new sellers, few buyers of all types, low contract signings, low closing numbers and low number of applications for mortgages. This means there is not much work around for agents, lenders, title companies, appraisers, inspectors, etc.
This is not pleasant, but it would be much more unpleasant if supply far exceeded demand. We still have very low levels of foreclosures and very few distressed sales.
We should probably bit a little more cheerful than we are.
Dec 3 - Based on affidavits recorded in Maricopa County, we have compiled the following data about November closings:
There were 1,364 new homes closed with a median sales price of $529,995. The unit count is down just 2% from November 2021 while the median sales price is up 18%. However I suspect that were more concessions hidden in that sales price than there were 12 months ago. Concessions are not recorded by the counties.
There were 3,969 re-sale homes closed with a median sales price of $429,900. The unit count is down a massive 55% from November 2021 while the median sales price is up less than 1%. The comment about concessions applies here too, so in reality re-sale prices net of concessions are probably lower than they were 12 months ago.
The contrast between the new and re-sale markets is greater than I have ever witnessed. New home closings and recorded prices remain quite strong, but the re-sale market has collapsed since March. 3,969 unit sales is the lowest total for November since 2007 and the median sales price has dropped almost 4% in a single month.
New home made up 25.6% of unit sales and almost 30% of dollar volume. And this is for Maricopa only. They have an even larger share in Pinal County, although that data will not be available for a few days.
The median for new homes has risen in each of the last 3 months and shows little sign of weakness. The median sales price for re-sales is down almost 12% since peaking in May.
All the above are for single-family and townhomes / condos combined.
Dec 1 - Here is our latest table of Cromford® Market Index values for the single-family markets in the 17 largest cities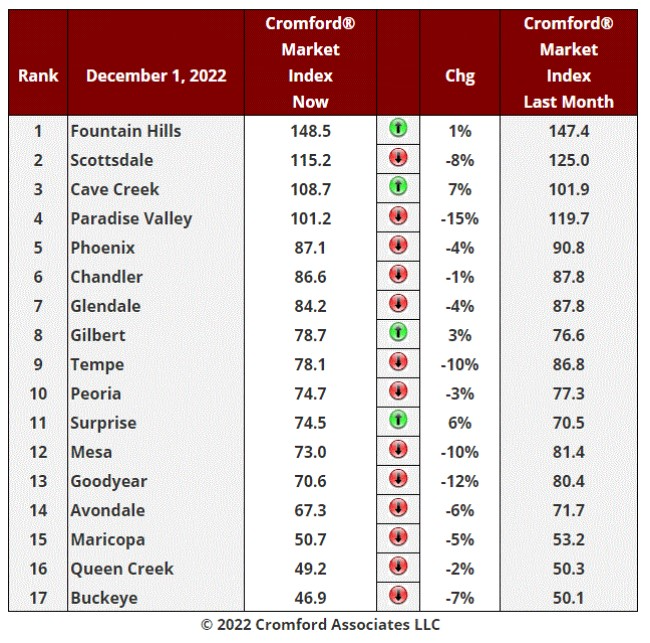
Twice as many cities are in the green zone this week with Fountain Hills and Gilbert joining Cave Creek and Surprise in showing an improving environment for sellers over the past month. The other 13 cities have deteriorated for sellers over the last month, but many of them have recently changed direction. Improving over the last week are: Avondale, Glendale, Paradise Valley, Peoria and Tempe. This leaves only 8 of the 17 cities still moving in buyers' direction. The previous deterioration for sellers is continuing to decelerate with an average change in CMI of -4.3%, a big improvement over -7.8% last week.
Confirming this positive trend we see that the overall CMI has turned around, having bottomed out at 88 on Tuesday and has starting to rise again over the last 2 days.
Nov 29 - The latest S&P / Case-Shiller® Home Price Index® numbers were published today.
The new report covers home sales during the period July to September 2022. This means they now fully reflect the weakening in the market during the third quarter.
Comparing with the previous month's series we see the following changes:
1. Chicago -0.59%
2. Cleveland -0.69%
3. New York -0.71%
4. Atlanta -0.75%
5. Washington -0.87%
6. Tampa -0.91%
7. Minneapolis -0.96%
8. Miami -1.01%
9. Charlotte -1.13%
10. Detroit -1.20%
11. Portland -1.25%
12. Boston -1.57%
13. Los Angeles -1.82%
14. Denver -2.00%
15. Dallas -2.06%
16. San Diego -2.11%
17. Phoenix -2.16%
18. Las Vegas -2.44%
19. San Francisco -2.90%
20. Seattle -2.93%
Phoenix has dropped from 15th to 17th place and remains below the national average, which was -1.01%.
All 20 cities are in negative territory month to month and the Southeast has started to decline faster. It is a very long time since Chicago and Cleveland were the top performers. The Pacific Coast cities are severely affected by the downturn especially the extremely expensive locations of San Francisco and Seattle.
Comparing year over year, we see the following changes:
1. Miami +24.6%
2. Tampa +23.8%
3. Charlotte +17.8%
4. Atlanta +17.1%
5. Dallas +16.3%
6. Las Vegas +12.9%
7. Phoenix +12.6%
8. Cleveland +10.6%
9. New York +10.6%
10. Chicago +10.0%
11. San Diego +9.5%
12. Denver +9.3%
13. Boston +8.8%
14. Los Angeles +8.8%
15. Detroit +8.0%
16. Portland +6.7%
17. Minneapolis +6.5%
18. Washington +6.5%
19. Seattle +6.2%
20. San Francisco +2.3%
San Francisco and Seattle are at the bottom of this table too, and it looks as though San Francisco could be the first of the 20 to go negative on a year over year basis.
Phoenix is in 7th place the same as last month.
Nov 28 - The single-family building permit counts have collapsed, with only 1,149 being issued in October 2022 for Maricopa and Pinal counties. This is the lowest monthly total since February 2015. It is also down 53% from October 2021. Refer to Cromford® Public chart CP23 for more details.
The single-family permit count year-to-date is 24,442 which is lower than all years from 1996 to 2006.
With such a drop in building plans, we are setting ourselves up for a shortage of supply next year should interest rates drop and demand for purchased single-family homes recover.
The situation is completely different with multi-family permits in Maricopa and Pinal. The construction of multi-family units is accelerating and we now have 15,925 units year to date as of October 2022. This is up more than 30% over this time last year. 2022 will be by far the strongest year ever for multi-family unit permits. Refer to Cromford® Public chart CP34 for more details.
Please note that access to Cromford® Public is not included with the standard Cromford® Report subscription. It is an upgrade costing $150 per year.
November 2022 Market Report
One-by-One, Most Cities in Greater Phoenix Succumb to a Buyer’s Market
44% of October Sales Involve Seller Paid Concessions to Buyer
For Buyers:
Greater Phoenix as a whole has been in a balanced market since August, but is expected to glide into a buyer’s market by mid-November. Buckeye, Maricopa and Queen Creek entered a buyers market in July. Surprise, Chandler, Gilbert and Tempe followed in August. Goodyear, Peoria and Avondale joined in September with Mesa and Goodyear falling in line by October. Phoenix is expected to succumb this month within a matter of days. The only holdouts remain in the Northeast Valley cities of Paradise Valley, Fountain Hills, Cave Creek and Scottsdale.
The 2022 peak of price was achieved in May, which was the result of contracts accepted in late March and April. Starting in June, sales prices revealed their decline in response to mortgage rate increases. At the end of October, the decline in average sales price per square foot since May was recorded at -9.1%, but still positive year-over-year at +5.7%. The largest declines happened between June and July at -4.5% and between August and September at –3.6%.
Mortgage rates have stabilized between 7.0-7.3% for the past 6 weeks, all of October and November-to-date, and continue to keep buyer demand low for now. This provides an opportunity for buyers as more sellers agree to contributing to closing costs and rate buy-downs. October sales saw 44% of sales involve a seller contribution to the buyer at closing, with a median contribution of $7,400. Closings in the first week of November showed a median contribution of $9,000.
The tricky thing is that these seller-paid concessions are not recorded with the sales price. It’s common to see a buyer offer a higher price in exchange for closing cost assistance or a rate buy-down. This tactic can make the sales price measures appear to drop slower or even stabilize as the cost to the seller increases underneath that number on the settlement statement.
The flaw in waiting for the market to bottom out before purchasing is that no one knows they’re buying at the bottom when they buy there. The bottom, or top, of the market does not become apparent until 3-4 months after the contracts were written. By the time most buyers figure out that the market hit rock bottom, they’re too late to the party.
For Sellers:
While the environment has turned quickly away from a seller’s market to an impending buyer’s market, and the cost to sell has increased significantly for sellers, most are still walking away from the closing table with a profit.
While most reports are focused on short-term price drops since May, or smaller year-over-year appreciation rates, appreciation rates for homeowners who have owned their home for at least 2 years are still impressive. Approximately 65% of MLS listings, excluding new construction, have been owned for 2 years or more. Appreciation rates based on sales price per square foot through the MLS are: 2 years: +33.6%, 3 years: +59.9%, 4 years: +68.1%, 5 years: +84.8%.
Fewer sellers are opting to sell in this market. Since the tipping point in June, weekly accepted contracts have fallen 36%, counterbalanced with a 34% decline in weekly new listings. Historically, October typically adds about 10,000 new listings to supply, but this October was the lowest recorded at just 7,334 new actives plus 188 in Coming Soon status, a record low for the month. This has caused supply to stagnate over the past 4 weeks and is a small relief for existing sellers. When supply self-regulates in response to lower demand, it puts less downward pressure on price. Not to say prices will not decline, they will, but it would be worse if supply were also rising. Contracts written in November and December will close in January and February next year. As Greater Phoenix glides into a buyer’s market this month, year-over-year appreciation rates are likely to turn negative in 2023.
Generally speaking, neither sellers nor buyers prefer to engage in real estate during times of uncertainty. Dramatic fluctuations in mortgage rates combined with insecurities surrounding inflation and unemployment have pressed pause on housing decisions for many sellers and buyers alike, for now. If mortgage rates drop, they’ll get off the fence.

Nov 26 - The average sales price per square foot has been drifting slowly down for the last 10 week, but not at any alarming speed. The chart below is for all areas & Types in the ARMS database and is measured weekly: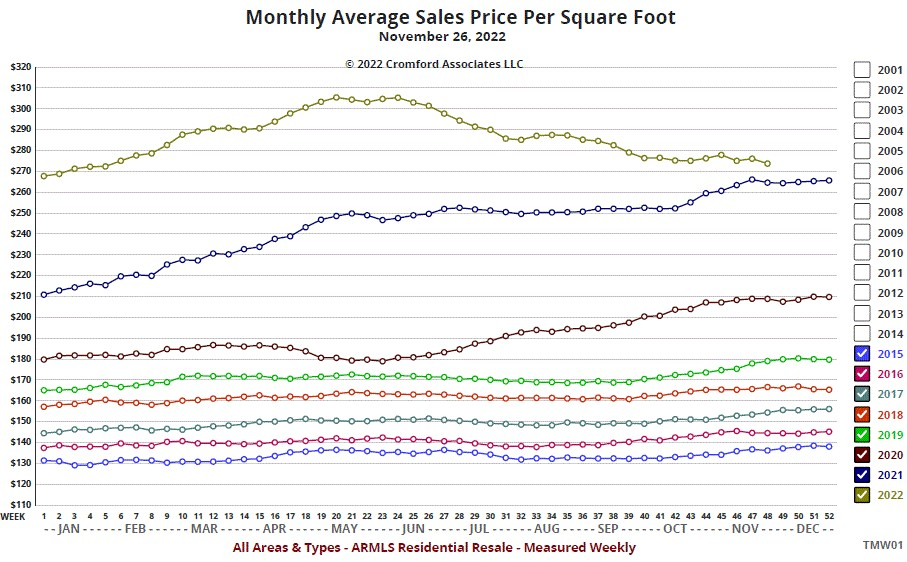
We are just under $274 today and were just over $279 at the end of September, so have lost about 1% per month. We still remain above last year's peak level by about $8.
Although the lack of demand causes concern, the shortage of supply goes a long way to counter-balance this and downward pressure on prices is fairly light.
Nov 24 - Here is our latest table of Cromford® Market Index values for the single-family markets in the 17 largest cities
Cave Creek has joined Surprise in showing an improving environment for sellers over the past month. The other 15 cities have deteriorated for sellers over the last month, but there are numerous signs that the situation is starting to improve gradually over the last 2 weeks. Paradise Valley declined 27% but almost all of this occurred 2 to 4 weeks ago and in the last four days, Paradise Valley's CMI has changed direction and looks to be headed back over 100 again.
The overall deterioration for sellers is starting to decelerate with an average change in CMI of -7.8%, an improvement over -9.8% last week.
With supply now dropping faster than demand, the next 4 weeks will probably show us more signs of stability becoming established.
Nov 23 - Only 6,713 new listings were added in the past 4 weeks. This is down 27% from last year and down 25% from 2020.
What is most amazing is that these unusually low numbers of new listings come less than 5 months after the record high of 12,246 was set on June 28.
Those who think the housing market is a bursting bubble are obviously wrong. In a bubble we have a stampede of sellers trying to get out. You could be forgiven for thinking a bubble was bursting in June, but there is no evidence to support that conclusion today. We have a tired and low volume market, but supply and demand are both very weak. If new supply stays as low as it is now, it would not take a large increase in demand to go back to a balanced market.
Nov 22 - The supply of homes for sale is dropping now and no doubt this trend will continue until the start of 2023, at least. However the supply of homes for rent remains on a strong upward trend.
Active rental listings in the ARMLS database, excluding short-term rentals, now number over 4,000 for the first time since January 2015. This is 123% higher than the same time last year.
All dwelling types are affected by the huge increase in homes listed for rent, for example:
single-family detached are up 128%
townhomes are up 122%
gemini/twin homes are up 110%
apartment-style homes are up 99%
patio homes are up 75%
With all this competition, the rents being asked have been falling for many months, which will please the Federal Reserve, but displease landlords. The average rent being asked for a single-family detached home is now $1.43 per square foot per month, down from $1.76 per square foot per month one year ago, a fall of 19%.
Apartments rents are much higher, because they tend to be located more centrally, but these are now trending down too. The average rent per square foot per month for apartments peaked at $2.26 last February but has declined since then to $1.86.
With interest rates in the mid to high sixes, the case for purchase over renting is weaker than it has been for a very long time, which exacerbates the demand problem that homes for sale are facing.
Nov 21 - With mortgage rates stabilizing for a while at a rate around 6.6% to 6.7% for a 30 year fixed loan, demand for homes has also stabilized, though at a very low level.
Listings under contract, measured daily, look like this: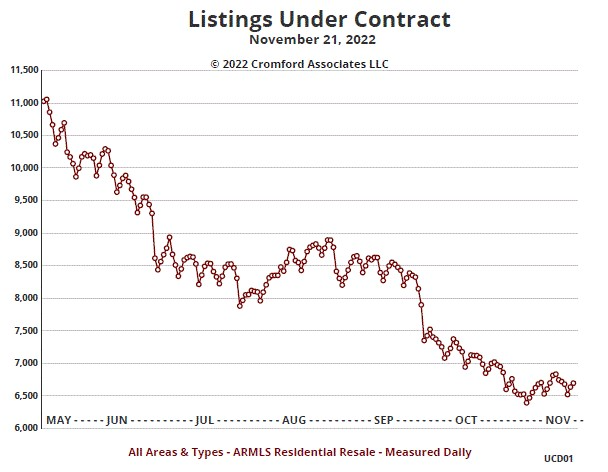
After plunging in October, there are signs of a slight recovery for demand in November as buyers get accustomed to interest rates that would have seem horrible 3 months ago, but look reasonable after a period when they exceeded 7% by a comfortable margin.
Even so, we have fewer than 7,000 listings under contract across all areas and types and we really should be well over 9,000 in a normal market. We almost achieved 9,000 in late August but the Federal Reserve took an ax to chop that down.
Nov 19 - The weakness of demand has been highlighted in the media but there has been relatively little discussion about the weakness of housing supply.
When we look at new listings arriving into the ARMLS database, we see a startling drop off in all the numbers. The column chart below shows the new listing counts for the first two weeks of November since 2005.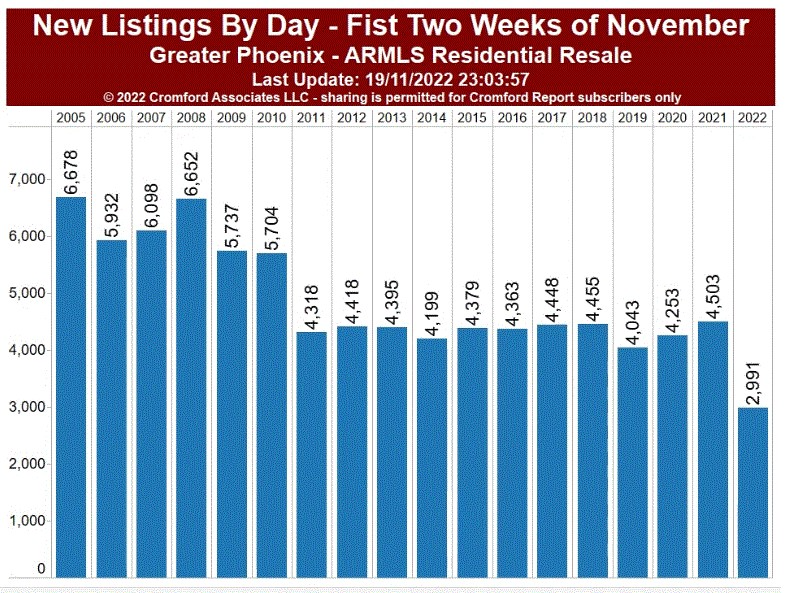
We can regard something around 4,250 new listings as normal, but in 2022 sellers have come up with fewer than 3,000.
Coming soon listings are also far below this time last year with around 400 which compares with over 600 in November 2021.
Back in 2005, when we experienced a rapid cooling of demand during the second half of the year, this brought on a lot of listings from people trying to exit the market before prices fell. There were large numbers of empty homes that had been purchased for speculative reasons. The situation now is completely different. A far higher percentage of homes are occupied and the high mortgage rates means moving home will eliminate a nice cheap mortgage and most likely require a new expensive one to take its place.
When we segment the market by dwelling type we can see that condos and townhomes are the most affected - new listings are down 38%. Single-family detached homes are down 33% while mobile and manufactured homes are largely unaffected.
Homes priced over $1 million are also little affected by the shortage of new listings.
Several of the central cities are experiencing a large drop in new listings - Phoenix is down 43%, Tempe down 37%, Scottsdale down 35%.
Gilbert is down 41%, Chandler down 47% but Mesa is only down 24%. On the west side, Peoria is down 47%, Glendale down 31% but Surprise down only 21%
With such a shortage of new listings, the downward pressure on pricing is moderated and overall active listing counts are starting to decline in the majority of areas.
Nov 17 - Here is our latest table of Cromford® Market Index values for the single-family markets in the 17 largest cities
Surprise is living up to its name by delivering a 3% improvement in its CMI over the past month. The other 16 cities, not so much. Paradise Valley declined 34% and appears to be rapidly heading towards a buyer's market. However the decline has slowed over the last week and it may yet stay in the balanced zone instead. Fountain Hills is now in a league of its own and only declined 3% over the last month. Conditions there have started to improve. Cave Creek is also pulling out of its decline and may see stability in the balanced zone pretty soon.
The deterioration for sellers is starting to decelerate with an average change in CMI of -9.8%, an improvement over -10.8% last week. Gilbert is one area where prospects for sellers and starting to improve slightly as supply declines.
Some of the secondary cities are also starting to improve, including Laveen and Tolleson.
Nov 16 - Tina has been looking into buy-downs of mortgage interest rates and found that 1,777 active listings in Maricopa and Pinal refer to the seller being willing to buy down the interest rate of the buyer's loan. This is 9.5% of the active listings in Maricopa and Pinal counties.
This is no doubt something that will appeal to many of today's buyers, who may be able to afford that house after all.
Nov 15 - We all know that demand is extremely low at the moment so you could be forgiven for thinking this would lead to a pile up of unsold active listings. It may therefore surprise you to learn that the active listing counts are now in a declining trend. It seems that sellers are even more discouraged than buyers and new listings are coming to market too slowly to meet demand.
This time of year we usually see active listings fairly stable followed by a decline between Thanksgiving and the end of the year. In 2022, the decline has started early and the numbers are falling at a faster rate than usual. We are going through unusual times, so I would hesitate to read too much into this, but for those looking for silver linings, this is a good one. It is something that should limit the downside risk to home prices.
Nov 14 - The market may not feel any different from yesterday, but the Cromford® Market Index for all areas & types has just slipped below 90. This means we are officially declaring a buyer's market.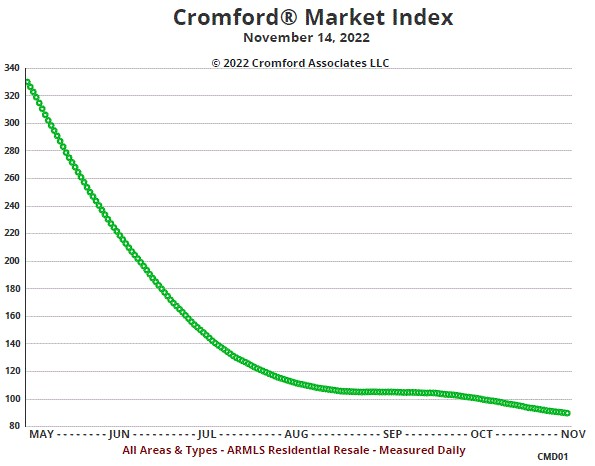
The majority of the market has been a buyer's market for some time, but the whole market has been propped up by the relative health of the luxury sector. With most of the Northeast Valley now surrendering to the widespread negativity we have an overall reading of 89.9, despite Fountain Hills holding out as a seller's market.
There is a faint flicker of positivity over the last few days since mortgage rates dropped last Friday. New contract counts are up a little and we also have a slight increase in incoming new listings. This probably won't change the balance in the market much, but it might increase transaction volumes, which would be welcomed by many.
Nov 12 - Dollar volume has obviously collapsed over the last six months. This is mostly due to the decline in sales volume. The decline in average sales price is much less significant.
In the chart below we compared 2022 with 2021, 2019 and 2005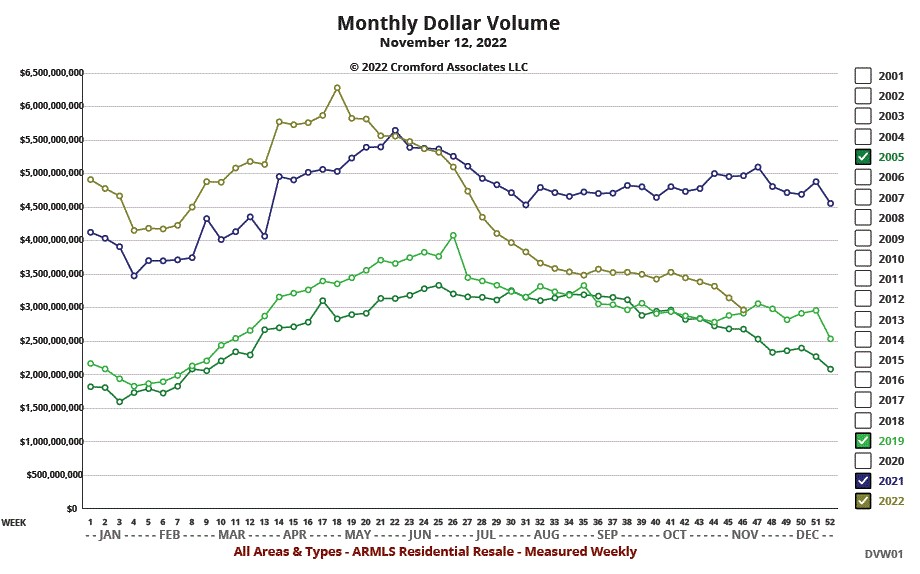
The level of dollar volume is now very close to the left in 2019 at the same point of the year.
For context, 2005 was a bubbly boom year and the current dollar volume is higher than November 2005.
Nov 10 - Here is our latest table of Cromford® Market Index values for the single-family markets in the 17 largest cities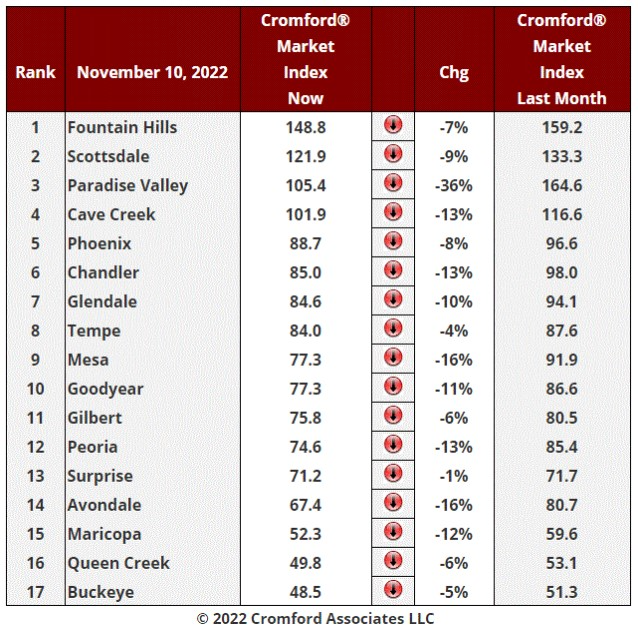
Once again all 17 cities have experienced a fall in their CMI over the past month and the average monthly change in CMI dropped to -10.9%, just a tad worse than -10.5% last week. Paradise Valley is again the most notable with a 36% fall in its CMI and is now in the balanced market zone. Cave Creek, Avondale, Mesa, Chandler, Peoria and Maricopa all fell 12% or more.
Least affected were Tempe, , Gilbert, Queen Creek, Surprise and Buckeye.
The Northeast Valley continues to be more favorable for sellers than the rest of the Greater Phoenix area, but it is rapidly losing much of that advantage.
13 cities are buyer's markets, 2 are balanced and 2 are still seller's markets, though Scottsdale is close to reaching balance. Only Fountain Hills remains as a clear seller's market for now.
Supply is starting to fall in several areas, which is a good sign, but demand has stayed stubbornly low. Interest rates dropped sharply today so we might see a few signs of some improvement in demand next week.
Nov 9 - To put the demand situation into context, it helps to look at the count of listings under contract. The chart below shows counts made every Saturday during 2022, 2021 and 2007 (the weakest year ever for demand).
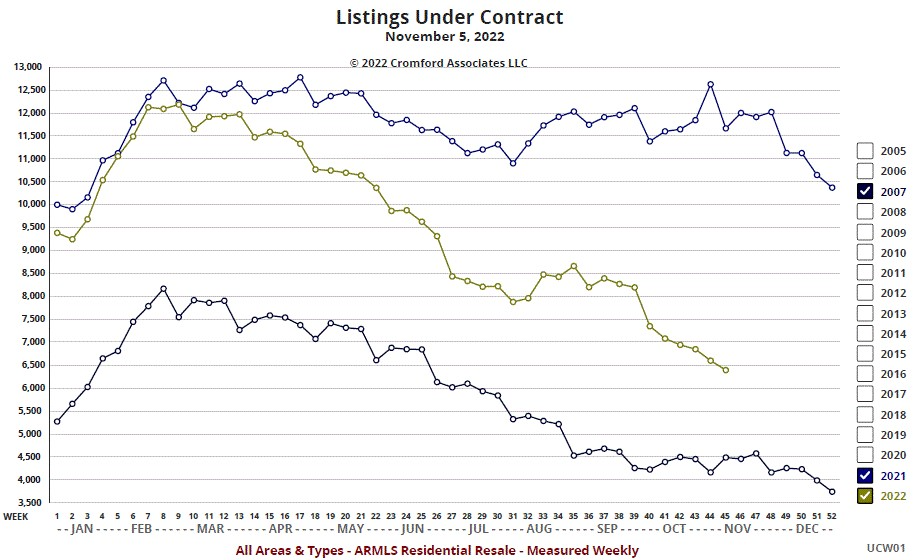
2021 was a strong year, and 2022 started well - almost as strong as 2021 until the end of the first quarter. Since then demand has weakened quickly in the face of higher interest rates, albeit with a pause in the decline during August and September. Since the end of September it has dropped further and is starting to approach the dismal levels of 2007. However we currently have about 1,900 more listings under contract than we saw at the same time in 2007, so things can be worse.
Under contract listing counts tend to fall during the last two months of the year, so it is still possible that we start 2023 at a lower level than we started 2007. The difference between now and 2007 is that we have far fewer active listings. There are also very few distressed active listings, so there is not as much downward pressure on prices as we saw in 2007.
Nov 7 - The iBuyers sold a lot fewer homes in Maricopa County during October than September, disposing of 280, down 40% from the 464 they sold in September. However both totals are completely dominated by Opendoor with OfferPad selling far less and the other players barely registering.
OfferPad saw their sales increase from 28 in September to 55 in October, which is actually their highest total since May.
Opendoor's sales dropped precipitously from 430 to 221. This decline helped October's average $/SF for the overall market as Opendoor's closing prices have often been below market value..
All this selling has not really solved Opendoor's excessive inventory problem. They have fewer active listings on ARMLS than the peak of 1,800 on August 1, but they still have 1,432 when they probably would prefer to have fewer than 400. It is going to take a long time to drop that inventory by 1,000 when demand is very low and still falling.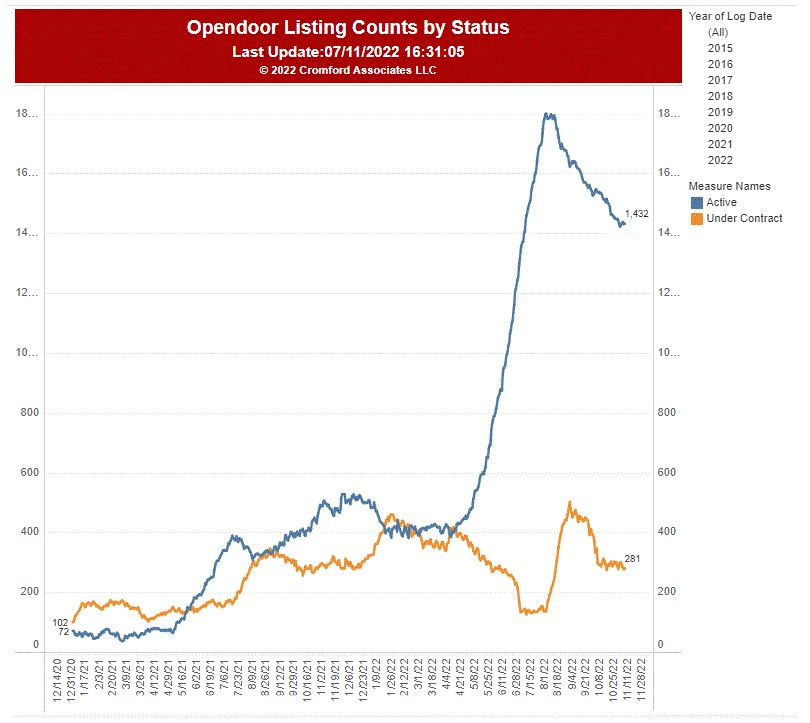
The chart include Pinal County but excludes homes owned by Opendoor but listed by other brokers (such as Kenny Klaus, Don Noma, Carol Royse, Redfin, etc.)
Nov 6 - The affidavits of value have been counted for Maricopa County in October and they reveal the following statistics:
There were 6,019 closed transactions - down 42% from October 2021
New home closings totaled 1,410 - up 4% from October 2021
Re-sale closings numbered 4,609 - down 49% from October 2021
Overall median sales price was $470,000 - up 11.2% from October 2021
Median new home sales price was $529,148 - up 18.3% from October 2021
Median re-sale home price was $447,500 - up 6.5% from October 2021
We can see that new homes are still faring much better than re-sales with a new record high median sales price, up 2.3% from last month. New homes now represent 23.4% of all closings.
Re-sale closings are down dramatically - the lowest monthly total since January 2009. The re-sale median sales price has fallen 8.1% since the peak of $486,000 in May 2022, but rose slightly during October..
All these numbers are for single-family detached, condos and townhomes combined.
Nov 3 - Here is our latest table of Cromford® Market Index values for the single-family markets in the 17 largest cities
The market continues to deteriorate sellers, with all 17 cities having seen a fall in their CMI over the past month and the average monthly change in CMI dropped to -10.5%, worse than -8.8% last week. Paradise Valley is the most notable with a 34% fall in its CMI, while Cave Creek, Avondale, Mesa, Chandler and Maricopa all fell 12% or more.
Least affected were Tempe, Surprise and Buckeye, although Buckeye returned to the bottom rung after Queen Creek clawed its way back to 16th place.
The Northeast Valley continues to be more favorable for sellers than the rest of the Greater Phoenix area, but it is losing much of that advantage with each passing month.
12 cities are buyers markets, 2 are balanced and 3 are still seller's markets, though heading fast towards balance.
Nov 1 - There has been a large shift in the intended purpose for homes purchased expressed on the Affidavits of Value filed in Maricopa and Pinal Counties.
This data is analyzed in the chart IU11 which is available in the Cromford® Public section of the site, an optional upgrade for existing Cromford® Report subscribers. I will summarize what can be deduced from chart IU11.
Between 2Q and 3Q of 2022, the change in intended use was as follows:
The percentage of homes purchased for investment fell from 20.9% to 18.0%, a fall of almost 14%
The percentage of homes purchased as second homes fell from 11.1% to 7.7% a reduction of over 30%.
The percentage of homes purchased by iBuyers for resale feel from 5.7% to 3.8%, a decline of 33%
The percentage of homes purchased as primary residences grew from 62.0% to 70.2%, an increase of 13%
Chart IU11 has filters for property type, transaction type, county, city, ZIP code, price range and for 55+ communities. This allows us to deduce that
More homes are purchased as primary residences in Pinal County (73.3%) than Maricopa County (69.9%)
New builds are overwhelmingly purchased as primary residences (85.4%), though the percentage purchased as investments has grown from 9.3% in 2Q to 10.4% in 3Q.
Normal sales that are conducted outside the MLS are dominated by investors (31.8%) and iBuyers (26.8%).
Oct 29 - Demand keeps getting weaker, but new supply is also getting lower every week. The market is shrinking and sellers and buyers are both thin on the ground. Sellers outnumber buyers, but not by a wide margin in the majority of areas.
Normally when prices start to go down, we get a flood of anxious sellers who want to dispose of their properties before prices get lower still. This is what we saw between April and July, but almost all those sellers have now gone. What is now ailing the market is a lack of motivation, both to buy and sell. In this situation prices are likely to drift lower, but not at a fast pace. In fact with the likelihood of even less supply in November and December, we could possibly see some price stabilization. This would leave us at the end of 2022 at roughly the same pricing level as the end of 2021.
Oct 27 - Here is our latest table of Cromford® Market Index values for the single-family markets in the 17 largest cities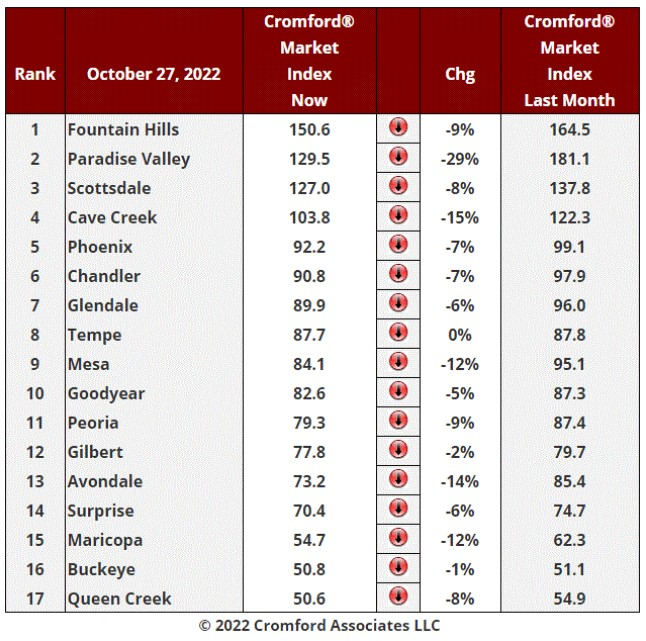
Yes, things are still getting worse for sellers, with all 17 cities having seen a fall in their CMI over the past month. The deterioration in the market continues to accelerate with the average monthly change in CMI at -8.8%, worse than -6.8% last week. Paradise Valley is the most notable with a 29% drop in its CMI, while Cave Creek, Avondale, Mesa and Maricopa all fell 12% or more.
Least affected were Tempe and Buckeye, the latter managing to escape the bottom rung and leaving Queen Creek in that unenvied position.
11 cities are buyers markets, 3 are balanced and 3 are still sellers markets, though all 3 are deteriorating rapidly.
Outside the Northeast Valley, Phoenix and Chandler are the strongest markets, but even these look likely to slip below 90 within the next couple of weeks.
Oct 26 - Dramatic trends are reported by the Census Bureau for building permits in Central Arizona. For Maricopa and Pinal Counties in September we saw only 1,485 single-family building permits. This is the lowest monthly total since February 2017 and down 36% from September last year. The single-family builders are slamming on the brakes.
The multi-family construction industry is going in the opposite direction at top speed. There have been 5,559 units of multi-family housing added to permits during the third quarter of 2022. This is up 47% from last year and almost the highest quarterly total we have ever seen. It is clear that 2022 will go down as the busiest year ever for multi-family permits.
It is odd that the two types of permits are going in opposite directions so quickly.
Oct 25 - The latest S&P / Case-Shiller® Home Price Index® numbers were published today.
The new report covers home sales during the period June to August 2022. This means they now reflect the weakening in the market during the third quarter.
Comparing with the previous month's series we see the following changes:
1. Cleveland -0.08%
2. Miami -0.12%
3. Charlotte -0.34%
4. Atlanta -0.40%
5. Chicago -0.48%
6. Tampa -0.51%
7. New York -0.54%
8. Detroit -0.64%
9. Minneapolis -0.95%
10. Boston -1.21%
11. La Vegas -1.33%
12. Washington -1.53%
13. Dallas -1.91%
14. Portland -1.94%
15. Phoenix -2.14%
16. Los Angeles -2.25%
17. Denver -2.29%
18. San Diego -2.76%
19. Seattle -3.87%
20. San Francisco -4.28%
Phoenix has dropped from 9th to 15th place and no longer remains above the national average, which was -1.07%.
The table looks very different from last month. All 20 cities are in negative territory month to month although the Southeast remains relatively strong, along with parts of the North. The Pacific Coast cities are most affected by the downturn especially the very expensive locations of San Francisco and Seattle. In the latter two cities, the drop in home price index is more than twice that of Phoenix.
I don't believe we have ever seen Cleveland top of the table before.
Comparing year over year, we see the following changes:
1. Miami +28.6%
2. Tampa +28.0%
3. Charlotte +21.3%
4. Dallas +20.2%
5. Atlanta +20.1%
6. Las Vegas +17.5%
7. Phoenix +17.1%
8. San Diego +12.7%
9. New York +12.3%
10. Los Angeles +12.1%
11. Denver +12.0%
12. Cleveland +11.5%
13. Boston +11.4%
14. Chicago +11.3%
15. Seattle +9.9%
16. Detroit +9.7%
17. Portland +8.6%
18. Minneapolis +7.6%
19. Washington +7.4%
20. San Francisco +5.6%
The average change nationwide was +13.0%, so Phoenix remained ahead of that measure. However it slipped from 6th to 7th place.
Bottom of both tables, San Francisco would seem to be in the most trouble.
Oct 24 - It is surprising that greater use is not made of the Listing Success Rate by other analysts. It is one of the most reliable measures of the health of the housing market and is both timely and accurate. The only serious problem it has is in January when it dives because of the large number of listings that expire on December 31. It pops back up again in February. This need not concern us right now when looking at the past 6 months: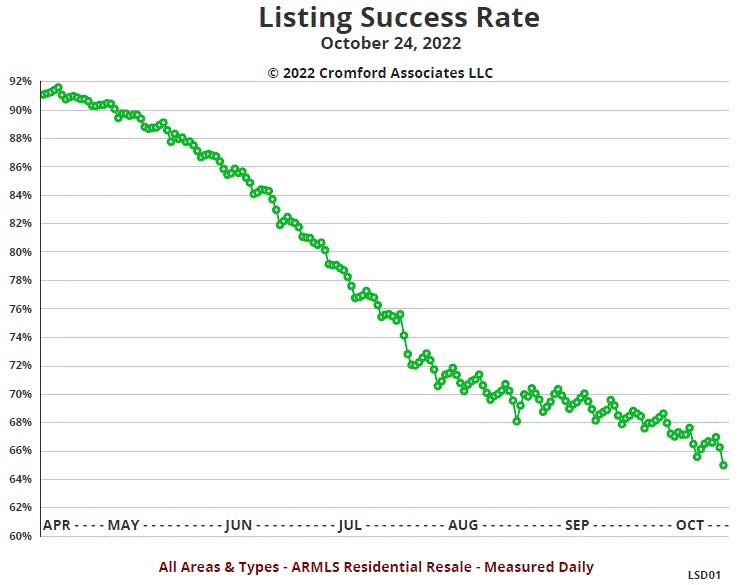
Anything over 80% is extraordinarily high and back in April we were still over 90%. The massive cooling trend brought us down to 70% by August and we have drifted lower since then. The key to interpreting the chart is to remember that 67% represents a normal balanced market with supply and demand roughly equal to each other. In the last month we have dropped below 67% and are currently recording a success rate of 65%. The rate of decline is slow but accelerating.
The market is extremely weak from a volume perspective, but it is close to normal when thinking about the balance between supply and demand. The fact that we have dropped below 67% is analogous to the CMI dropping below 100. Buyers have an advantage over sellers, but it is not yet excessive. For those who have entered the Phoenix housing market within the last 14 years, we should point out that we saw listing success rates as low as 23% in early 2008. That was a truly dreadful market for sellers. The current situation only looks bad when compared with the last 10 years. Compared with 2008 it looks just peachy.
Oct 23 - The new listing count has collapsed recently as shown in the chart below, which features the first 21 days of each October since 2005: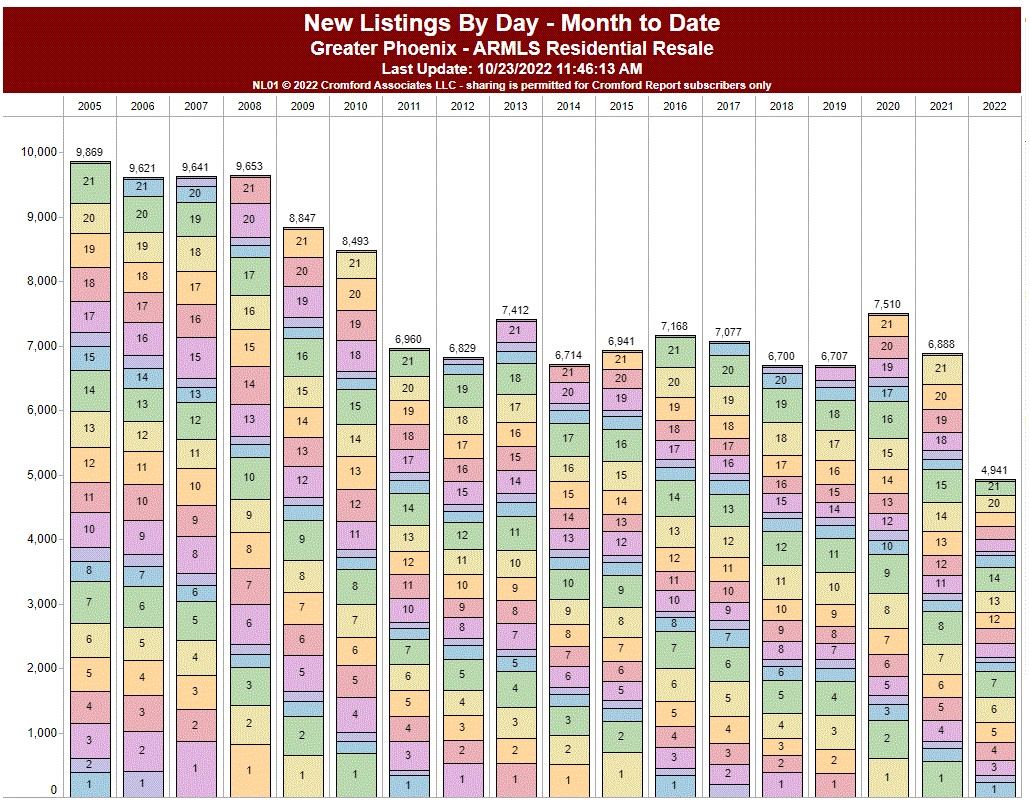
Everyone is focused on how weak demand has become thanks to rising interest rates. However the same phenomenon is affecting new supply too. Existing home owner occupiers are very reluctant to lose the mortgages they already have and so motivation to list and sell homes is very low. Total supply is still rising slowly because although new listings are scarce, new contract signings are even scarcer.
Both supply and demand are in the doldrums and the downward trend is continuing.
Oct 21 - Here is our latest table of Cromford® Market Index values for the single-family markets in the 17 largest cities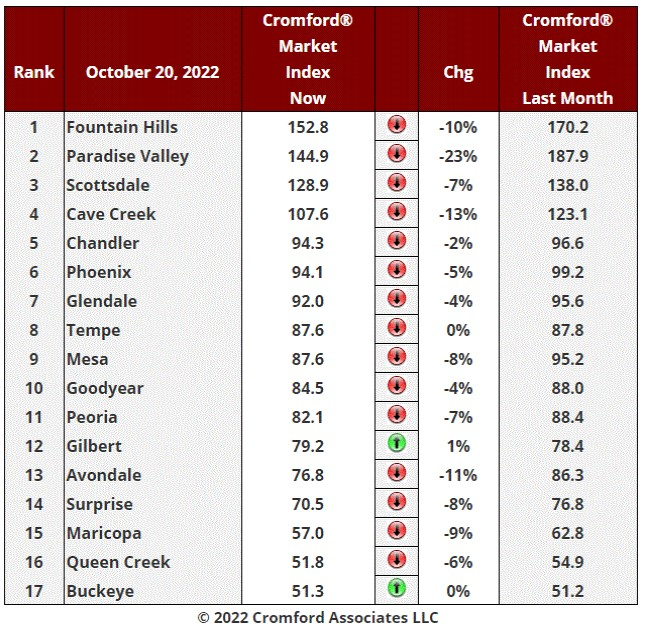
The deterioration in the market continues to accelerate with the average monthly change in CMI at -6.8%, markedly worse than -4.6% last week. Two of the 17 cities (Gilbert and Buckeye) managed to achieve a small rise in their CMI, but 15 cities moved in favor of buyers. Of these, Paradise Valley is the most notable with its supply increasing 34% in the last month. It slipped from first place leaving Fountain Hills at the top, despite it falling 10% over the last month.
10 cities are buyers markets, 4 are balanced and 3 are still sellers markets, though deteriorating rapidly.
It looks increasingly likely that all cities except those in the Northeast Valley will be seller's markets within two weeks.
Oct 20 - In most years, mortgage interest rates do not have a large impact on the housing market. Other factors have a greater influence that usually overwhelms the effect of any fluctuations in rates. This is not one of those normal years.
This is because the changes in interest rates have been both fast and enormous. Here is chart showing the 30 year fixed rate reported by MND over the past month:
We can see that rates increased by 14% from 6.47 to 7.37 over the last month alone. This is a colossal hit to affordability in a very short time and the consequent reduction in demand is rippling through the industry in ways that have not been experienced since the 1980s.
High interest rates make demand fall, but on their own they do not make prices fall. That depends on supply and market sentiment. It is a mixed story on these. Market sentiment is unusually poor (which funnily enough, is often a good sign that things will shortly improve). Supply is also weak, with sellers discouraged. The keeps prices much higher than if supply were rapidly increasing.
The market is moving in favor of buyers, but nothing like as fast as it did during the bursting of the 2005-6 bubble. Without a source of extra supply, prices are very likely to retreat but relatively slowly and modestly. Any talk of massive price drops is pure speculation. I am not saying it cannot happen. Any thing is possible in the right (or wrong) circumstances. But if supply stays tight, then price movements are likely to be slow and gentle, not sudden and violent.
Oct 18 - Tina has put a lot of effort into improving the Tableau chart covering seller concessions to buyers. Here is the front page chart from yesterday: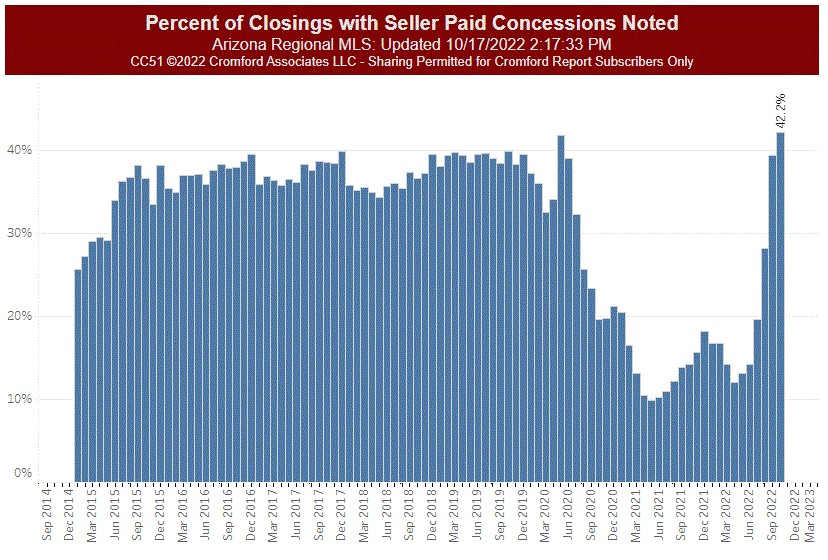
Seller concessions were popular between 2015 and mid 2020 with between 35% and 40% of closed listings involving some form of concession to the buyer.
Concessions went out of fashion between mid 2020 and April 2022 as each home had multiple prospective buyers who would have less chance of securing the home if the requested concessions.
In June we are seeing record percentages of concessions. Another section of the same Tableau chart shows us that the size of concessions is increasing too.
Oct 17 - The Cromford® Market Index fell below 100 today. The last time the CMI was below 100 was July 1, 2014.
Oct 15 - How bad has the market become? From a unit volume perspective, it is poor, with closings and especially contract acceptance well below a level needed to satisfy the professional participants who just 6 months ago were dealing with extremely high levels of activity.
From a dollar volume perspective, it does not look so bad. Dollar volume was colossal during the first and second quarters and took a big drop during the third quarter. However compared with prior years, dollar volume is still quite impressive, mainly because prices are still very high compared with all prior years.
The chart below shows the peak early this year at almost $6 billion, followed by the plunge during July to September. But it also shows that we remain well over $3 billion
Even now, monthly dollar volume stands at $3.42 billion, which is the third highest total for week 42, beaten only by 2020 and 2021. During the boom of 2003 through 2005 we rarely exceeded $3 billion.
Oct 14 - Our second largest iBuyer, OfferPad is headquartered locally and has adopted a very different approach to the market downturn compared to Opendoor.
They too found themselves with excessive inventory after their second quarter purchases. They bought 446 homes between April and June, but sales dropped off alarmingly from May onwards and by the end of August they had 496 homes in stock. Their average monthly sales had dropped from 217 in March to only 31 in August. This means that at the start of September they owned 16 months of supply.
They reduced their buying activity dramatically from August onwards and purchased only 22 homes in September. This is down 86% from September last year. They put more effort into sales, but did not make the huge cuts in asking prices that we saw from Opendoor. They maintained their high level of buyer broker compensation (again unlike Opendoor) but have not reported large concessions to the buyer (again unlike Opendoor).
As a result their sales have picked up only slightly and numbered 43 in September, down 51% from the year before. With 43 sales and 22 purchases, their inventory did shrink during September, but only from 496 to 473. This still represents over 11 months of supply. 11 of their 43 sales were in bulk to institutional investors and handled outside the MLS.
This strategy has led to a huge drop in sales and purchase volumes, but it has avoided the large negative gross margins experienced by Opendoor. In September, OfferPad sold 43 homes for $18.8 million which had cost them $18.8 million. 56% of homes were sold for less than they cost and 44% sold for more. They still have the 5% fee they charged the original seller, and we estimate they paid 4.7% in buyer broker commission and bonuses plus concessions to the buyers. This leaves them with a slim but positive contribution margin of 0.3%. It's not much but it is a lot healthier than the -10.2% we calculate for Opendoor using the same methodology.
Oct 13 - Here is our latest table of Cromford® Market Index values for the single-family markets in the 17 largest cities
The number of cities with an improved CMI over the past month has fallen again to just 3. Scottsdale and Glendale have turned negative leaving just 3 cities all in the Southeast valley.
The deterioration in the market is accelerating with the average monthly change in CMI at -4.6%, considerably worse than -2.4% last week.
We see notable declines in Paradise Valley and Fountain Hills, both leaders in the table for several months but now showing signs of weariness. No city is above 160 and 13 are below 100.
Oct 12 - As if we didn't have enough to worry about, it is roughly twice as hard to get a contract all the way through escrow as it was this time last year.
If we look at the Tableau chart New Contracts versus Back on Market we can see that 428 listings that were pending, CCBS or UCB went back to active status in the week that started on October 2, 2022. This is about 6.5% of the listings under contract falling through and being re-marketed each week.
At the same time last year we had 3.4% of contracts in escrow going back on the market each week.
We also have a lot fewer listings under contract to start with - 6,593 when we last checked, compared with 10,894 this time last year.
Oct 11 - Another market indicator that tells an accurate story is the Listing Success Rate: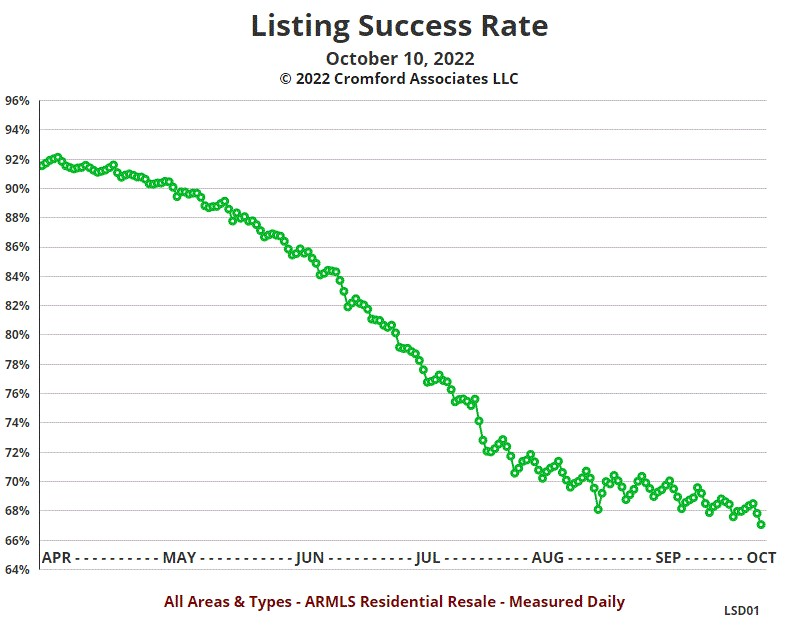
Anything over 90% is extraordinarily high. The market dipped below that level in mid-May and fell rapidly to the 70% level by August. It is now at a level which we would regard as close to the long-term average. Roughly one out of three listings fail to sell. This may not seem normal if you have only been an agent for a few years, but in the long-term it is very much typical of a balanced market. The Greater Phoenix market has experienced long periods where the listing success rate was below 50%, so although market sentiment is poor, the listing success rate is not a reason to feel bad.
A very good reason to feel bad is the volume problem. A balanced market with high volumes is much better than a balanced market with low volumes. Many real estate professionals depend on transaction volume being strong to earn a good living. Right now we have very weak transaction volumes but we have the appropriate number of agents to service a far larger volume of sales. Some agents are going to be very short of work. This also extends to mortgage lenders, title and escrow staff, insurers, property inspectors, home guarantee salespeople and appraisers.
There is just not enough work to go around. Most experienced and successful professionals will continue to prosper but those who have not planned how to deal with the new situation will probably struggle for quite some time.
Oct 10 - The listings under contract chart has deteriorated over the last week:
I know it is only a week since we published this chart, but the last 7 days have seen the under contract count fall to below 7,100. This is the lowest level for the time of year since 2007 and emphasizes just how far demand has collapsed since April. With interest rates over 7%, a large section of potential buyers are priced out of the market.
However many sellers are also discouraged, as moving home would lose them the cheap mortgage rate they currently enjoy. We are seeing new listings arrive at the rate of just over 2,000 per week. We would normally see 2,400 to 2,700 at this time of year. Even so, contracts are getting signed at such a slow rate that inventory is starting to build again. Not at a dramatic speed, but the current rate is an extra 500 active listings added per week across all areas & types in the ARMLS database.
Supply is therefore growing while demand is falling which is driving the Cromford® Market Index lower - there is little doubt that it will fall below 100 within a week or so.
Oct 8 - Many measures are very slow to react to changes in the market are less useful for this reason. Average days on market is one of these and we advise subscribers to pay scant attention to this oft-quoted but almost useless statistic.
One of the earliest statistics to react is the contract ratio, which can be found in the definitions section and is based of the ratio between listings under contract and listings available for purchase. It is a simple measure of the balance between supply and demand, with high number indicating high demand and low supply while low readings indicate the opposite.
If we look at the entire market within Greater Phoenix, that is, the ARMLS database but excluding out of area listings, we can see the following movements in the Contract Ratio:
1. We started 2022 with 159.5 (frenzy!) and quickly rose to 258.9 (insanity!!) for the week beginning Feb 20. This was not quite the all-time high because we recorded 287.4 for week beginning March 27, 2021
2. During March the contract ratio started to edge lower, reaching 249.0 by week beginning March 26. This was still insanity with crazy bidding wars.
3. In April the contract ratio started a relentless and speedy decline, reaching 168.6 by the end of April and 98.3 by early June. This is still a hot market reading, but the speed of the fall over the 9 weeks shouted a warning to everyone that the market was cooling fast.
4. By the beginning of July, the contract ratio had dropped to 58.3. We regard 60 and above as indicative of a hot market. 58.3 is in the "normal" range
5. By the end of July the contract ratio had fallen to 44, but here it found its footing. The mid-40s are very normal, with the market close to balance.
6. The contract ratio recovered slightly in August then fell back slowly again until we reached 40.9 in late September. Still in the normal range, but weakening.
7. October has seen another rapid decline in the contract ratio and we are at 34.3 as of October 8, which is at the cool end of normal
8. We regard readings below 30 as indicating a cold market and it appears we are slipping towards that boundary.
A price range which is exhibiting an unusually low contract ratio is $400,000 to $500,000, where we have slipped from 35.8 to 30.6 over the past 2 weeks. This is the range that looks most vulnerable to becoming a cold market.
Oct 7 - Opendoor increased their selling efforts during September. Based on affidavits of value recorded in Maricopa and Pinal counties, Opendoor disposed of 503 houses in total, a massive 144% increase on the 206 they sold in August. This can be regarded as a sales success, but it came at a significant cost. Almost 88% of those homes were sold for less than Opendoor paid for them, in many cases significantly less. Here are some statistics based on the county filings:
The average sales price was $431,077 down 5.8% from the average in August.
The homes Opendoor sold had cost them an average of $475,697, meaning that Opendoor lost an average of $44,620 on each home, or $22.4 million in total.
The gross margin was -10.4%, so although they had charged the original seller a fee of 5% of the purchase price, the loss on sale was about double the gain on purchase.
Some of the sales included financial concession from Opendoor to the buyer, adding $2,56 million, or 1.2% to their losses
They spent $5.2 million on buyer broker commissions and bonuses, adding 2.4% to their losses.
The average time each home was owned was 125 days (over 4 months), so with the slower turnover, holding costs start to mount. These include property taxes, HOA dues, utilities (they have to be air-conditioned for showings), insurance (empty homes are higher risk than occupied homes) and interest on the capital used to buy the homes. They also incurred refurbishment costs, even though in many cases, these were minimal, and transaction costs although those are reduced by them using their own in-house title company.
Some sales (we counted 30) were made to institutional investors, which eliminates the need to pay buyer broker commissions and concession to the buyer, but it also tends to make for lower sales prices.
From even a cursory glance, it is clear that in a sudden market downturn such as the one we have experienced in Greater Phoenix during 2Q and 3Q 2022, it is hard for Opendoor to generate a positive gross margin, never mind a net profit after operating expenses.
They have not stopped buying, adding another 159 homes to their inventory during September according to filings. However their offers are now far less aggressive than they were prior to July and they have a better chance of achieving a positive gross margin with their more recent purchases than with the homes purchased before August. Total inventory is down to about 2,100 from almost 2,500 at the start of September. This is a significant step forward, but they still have excessive inventory considering the state of the market and their monthly sales rate.
As another measure of their sales success, during September about 1 in every 16 sales in Maricopa County was by Opendoor. But because they represent such a significant slice of today's market, and their sales pricing is measurably lower than the market as a whole, they are contributing more than their fair share to the fall in prices. This is a feedback loop, since their sales efforts tend to reduce the value of their remaining inventory.
Oct 6 - Here is our latest table of Cromford® Market Index values for the single-family markets in the 17 largest cities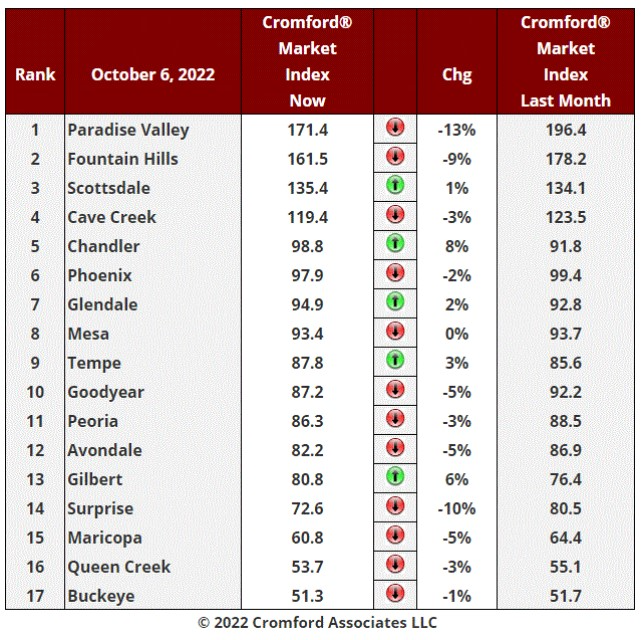
The number of cities with an improved CMI over the past month has fallen to 5. Mesa has turned around, but Scottsdale, Gilbert, Chandler, Tempe and Glendale are still managing to show an improvement for sellers compared with a month ago. Given the poor start to the fourth quarter, I do not think this is likely to last.
The market can be seen to be gradually deteriorating again because the average monthly change in CMI was -2.4%, worse than -1.5% last week. In fact if we focus on the most recent week, the market is moving against the interests of sellers. Demand is falling while supply is rising again.
We experienced about 8 weeks of relative stability in the third quarter, but with the 30-year fixed interest rate around 7%, affordability is adding another degree of hurt to would-be buyers.
Oct 4 - The affidavits of value have been counted for Maricopa County in September and they reveal the following statistics:
There were 7,174 closed transactions - down 36% from September 2021
New home closings totaled 1,599 - down 4% from September 2021
Re-sale closings numbered 5,575 - down 42% from September 2021
Overall median sales price was $462,994 - up 11.6% from September 2021
Median new home sales price was $517,456 - up 25.3% from September 2021
Median re-sale home price was $445,000 - up 7.2% from September 2021
We can see that new homes are faring much better than re-sales with a new record high median sales price, up 1% from last month. New homes now represent 22.3% of all closings.
Re-sale closings are down dramatically - the lowest monthly total since January 2016. The re-sale median sales price has fallen 8.4% since the peak of $486,000 in May 2022.
All these numbers are for single-family detached, condos and townhomes combined.
Oct 3 - The listings under contract chart has suddenly shot a warning cannon across our bows.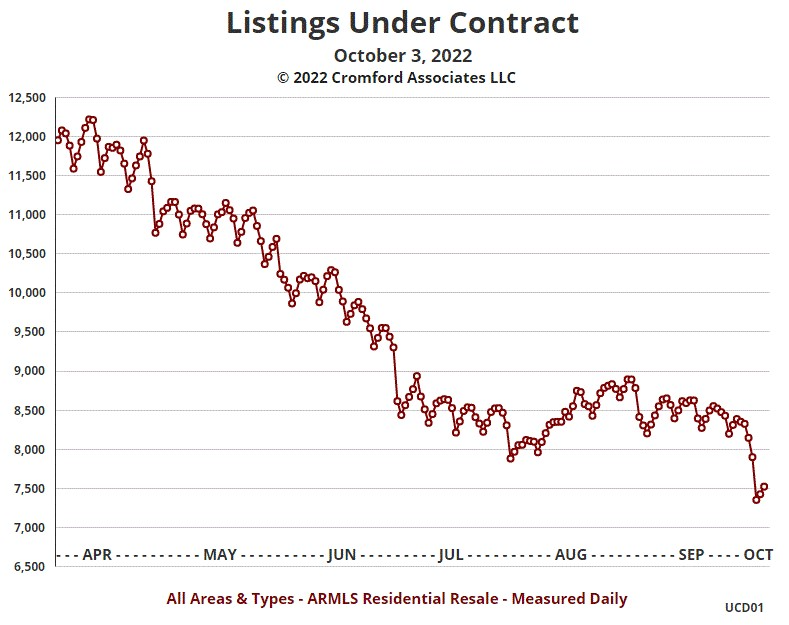
This is a much more negative view than the one we published just a couple of weeks ago, which we described as worrying at the time. A drop below 7,500 at a time when the autumn buying season should be fully under way is not a good sign. Only 2007 and 2008 gave us lower readings than this.
It suggests that another leg down in demand has followed the recent rise in mortgage interest rates. Not exactly surprising, but the drop is even larger than we anticipated.
Oct 2 - The total number of active listings without a contract has just exceeded 20,000, across all areas and types, excluding UCB and CCBS listings. This is the first time we have broken through the 20,000 barrier since March 2017. However 20,000 is still below the long term average , which is around 25,000.
While it is true we no longer have a supply shortage, we do not have an excess of supply either, at least when we examine the market as a whole. Things get a bit more complicated when we look at counts by price range.
In certain price ranges, supply can appear very high compared to the long term average. For example:
for single-family detached homes priced between $350,000 and $400,000 we have 2,082 active listings. This is the highest count since January 2008.
for single-family detached homes priced between $400,000 and $500,000 we have 4,456 active listings. This is the highest count we have ever seen.
for single-family detached homes priced between $500,000 and $600,000 we have 2,510 active listings. This is the highest count since December 2007.
You might be thinking - wow - those are high active counts if they are setting new records like that, especially for the $400,000 to $500,000 segment. But this is because $400,000 to $500,000 is the new normal. The median sales price falls in this range and closed listings are also relative high for this price range compared to the long-term average.
The key is to look at the how the active inventory count compares with the current sales rate:
$350,000 to $400,000 we have 3.3 months of supply at the current monthly sales rate and 75 days of inventory at the current annual sales rate
$400,000 to $500,000 we have 3.8 months of supply at the current monthly sales rate and 87 days of inventory at the current annual sales rate
$500,000 to $600,000 we have 3.7 months of supply at the current monthly sales rate and 90 days of inventory at the current annual sales rate
These supply statistics are high compared to the last several years, but not even above average from a long term perspective.
With interest rates still moving upwards, things could certainly get worse from here, but we should not misunderstand the situation right now. These price ranges are looking very normal from a supply versus demand perspective. We will see prices fall for sellers who hold a weak hand or are impatient, and because sentiment is poor after such a positive 2 years. But this is not what a crash look like.
It is what a correction looks like and it would not be at all surprising if prices in December 2022 look similar to those in December 2021.
Sep 29 - Here is our latest table of Cromford® Market Index values for the single-family markets in the 17 largest cities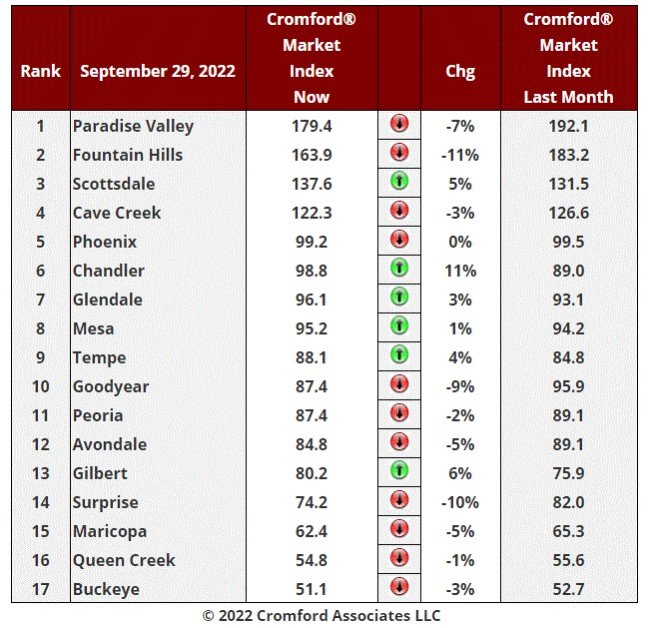
The number of cities with an improved CMI over the past month has increased to 6. Glendale, Mesa and Gilbert have joined Scottsdale, Tempe and Chandler but Paradise Valley has turned around and headed down again. Fountain Hills is down by the highest percentage, with Surprise and Goodyear just behind.
A mixed picture but the average monthly change in CMI was just -1.5%. This is the smallest monthly deterioration since the downturn started in March and another improvement on the week before when the reading was -2.5%. The deterioration has slowed markedly during the past six weeks but it has not stopped completely. The average decline over the last week was 0.7%, but this is not good news as it is larger than the last 2 weeks.
The situation in Phoenix, Scottsdale, Glendale and the inner Southeast Valley (Tempe, Mesa, Chandler and Gilbert) is noticeably better than in the areas further out. The inner areas are seeing demand fall less and supply grow slower.
Interest rates are now far higher than they were at the start of September and we anticipate weak contract signings as a result. However the supply of new listings keeps getting weaker and it appears higher rates are discouraging sellers almost as much as buyers.
The biggest problem this creates is a lack of transaction volume. This is not good for agents, brokers, mortgage lenders or title and escrow professionals. Appraisers, insurers and home inspectors will also be facing low volumes compared with the last 10 years. Their mood is likely to be very downbeat.
However the downward pressure on pricing is far less than it might be if new listings were flooding the market. iBuyers are still facing excessive inventory and selling it off cheaply, but compared with the overall market, their holdings are far lower than the huge foreclosure wave that hit us between 2007 and 2011.
This might not seem too positive a picture, but remember that we are at the despair phase of the housing cycle. Even the tiniest signs of progress will be swamped by negativity during this phase.
Sep 28 - We have updated all 10 charts in the Cromford® Public section of the site with the latest building permit counts for Arizona. These numbers are provided to us by the US Census Bureau and allow us to monitor future supply of new homes in the single-family and multi-family segments.
When the housing market started to head south in 2005, the home builders accelerated their construction plans and kept building single-family homes in Central Arizona at record high levels for another two years. It was not until August 2007 that new single-family permits dropped below 2,000 per month. They would not see that 2,000 level again until 2018, 11 years later.
This time round, things are very different. Builders are more cautious and have scaled back their building after the recent market weakness. In July and August we are seeing roughly 2,000 per month, well down from the 3,000 a month level we were seeing a year ago, and the annual permit rate is trending down.
Builders of multi-family homes are much less cautious. The annual rate of 19,086 multi-family permits for Maricopa & Pinal counties is the highest we have ever recorded and up 36% from the 14,073 we saw a year ago.
Sep 27 - The latest S&P / Case-Shiller® Home Price Index® numbers were published today.
The new report covers home sales during the period May to July 2022. This means they now reflect some of the weakening in the market over the past several months.
Comparing with the previous month's series we see the following changes:
1. Miami +1.29%
2. Cleveland +0.96%
3. Chicago +0.66%
4. Atlanta +0.64%
5. Charlotte +0.62%
6. Tampa +0.56%
7. New York +0.16%
8. Las Vegas +0.05%
9. Phoenix -0.12%
10. Detroit -0.13%
11. Minneapolis -0.16%
12. Boston -0.28%
13. Dallas -0.42%
14. Washington -0.72%
15. Portland -1.10%
16. Denver -1.40%
17. Los Angeles -1.60%
18. San Diego -2.53%
19. Seattle -3.06%
20. San Francisco -3.47%
Phoenix stayed in 9th place but remains above the national average, which was -0.33%. The table looks very different from last month. The majority of the 20 cities are in negative territory month to month although the Southeast remains relatively strong, along with parts of the North. The Pacific Coast cities are most affected by the downturn especially the very expensive locations of San Francisco and Seattle.
Comparing year over year, we see the following changes:
1. Tampa +31.8%
2. Miami +31.7%
3. Dallas +24.7%
4. Charlotte +23.6%
5. Atlanta +22.8%
6. Phoenix +22.4%
7. Las Vegas +21.8%
8. San Diego +16.6%
9. Los Angeles +15.7%
10. Denver 15.6%
11. Seattle +14.5%
12. New York +13.7%
13. Boston +13.3%
14. Chicago +12.7%
15. Cleveland +12.4%
16. Portland +11.7%
17. Detroit +11.4%
18. San Francisco +10.8%
19. Washington +9.4%
20. Minneapolis +9.0%
All cities are still much more expensive than last year, with the national average increase at 15.8%.
However the trend has definitely changed direction from last month
Sep 25 - After the most dramatic changes in supply and demand between April and July, the market has settled down and is making only small moves over the last few weeks. Despite the recent rise in interest rates, demand has not collapsed further, but remains pretty much at the same low level as last month. The arrival rate of new listings for sale is very low for the time of year. So in complete contrast to the second quarter, we have low new supply to accompany low demand. Contracts are being signed but so slowly that the active supply count is drifting higher as listing stay on the market longer. Things are surprisingly normal in terms of balance, but transaction volumes are much lower than we have been used to over the past decade.
There is little downward pressure on prices in this situation and what pressure there is has been largely caused by the overstocked iBuyer Opendoor. Other sellers are being more patient. Sentiment remains poor and confidence is low. If you have to sell quickly, you are facing a challenge and will probably need to sharpen your negotiating pencil. But foreclosures are at very low levels and anyone who expects a flood of distressed properties and lender-owned homes to drive prices down is dreaming of 2007. It is not happening in 2022 and probably not happening in 2023 unless economic conditions deteriorate far more than anticipated.
This is not a crash. The overabundance of enthusiasm and confidence we saw in March has evaporated and the market has started operating like it does when overall supply and demand are in balance. The is a strong overtone of fear, but this fear is not based on anything more solid than uncertainty. This calls for marketing skills and patience, not panic and freakish discounting. Keep calm and carry on.
You might think that mortgage rates over 6% are a big problem, but the housing market has operated for many decades with rates over 6% without it causing a meltdown. I remember when anything below 8% was regarded as a cheap loan. Yes, demand will be much lower while rates are high, but the thing everyone has to fear most is an over-abundance of supply. Right now, the evidence points the opposite way. New supply is tight and looks likely to remain that way for some time.
Sep 21 - The last couple of months have been a torrid time for the iBuyers. Having been on a buying spree during the second quarter, they found themselves with far too much inventory at the start of the third quarter. A large percentage of these homes were purchased at prices that are in excess of their current market value.
So far as we know, they have not cancelled contracts, but have allowed them to complete. However their buying has been cut back dramatically now as they focus on selling what they have instead of buying too many more. Most of those sales are going to be at a loss. For Opendoor, 77% of the homes sold in Maricopa and Pinal counties during August were sold for a loss and only 23% made at least some gross margin. The average gross margin was -6.2% during August and it has dropped further during the first 2 weeks of September.
Opendoor has clearly decided to use price-cuts to sell their excess stock of homes as quickly as possible, and they have used them very aggressively. For homes that Opendoor has sold since August 1, the average reduction between initial list price and final list price is 13.1%. A few homes have seen their list prices drop by more than 20%. In addition to low list prices, they have agreed to some large concessions to buyers of up to 5.6%. though the average concession is a tad below 1%. Until last week they were offering a $3500 bonus to the buyer's broker too, though this disappeared on September 15. They have also accepted quite a few low-ball bids well below their already low list prices. This is what distressed sales look like in 2022.
The effort has worked to the extent that Opendoor unit sales have increased sharply from only 21 during the first week of August to almost 100 in each of the last 3 weeks. However they still have a lot of inventory left. Somewhere between 1,550 and 1,600 active listings as of last night. This is enough to last approximately 4 months, which takes us to the end of the year at their current sales rate.
The average price per sq. ft. for homes under $800,000 sold by Opendoor has declined from $256.14 in May to $229.07 in September. This is a much larger decline than for the market excluding Opendoor. Homes sold by regular sellers (i.e. not iBuyers) declined from $268.98 to $256.08. So Opendoor's price has dropped by well over 10% while the rest of the market dropped by just under 5%.
OfferPad has not attempted to sell off excess inventory at low prices on the MLS. They have dropped prices for a few listings, but nowhere near the size and frequency of cuts that Opendoor has implemented. However they have sold a batch of 19 homes in bulk to an institutional investor. This incurred a gross margin loss of 6.3%. But maintaining their list prices has meant OfferPad's sales are few and far between. Only 39 homes were sold by OfferPad in August - their lowest monthly total since April 2018. This also means their inventory is stuck at around 400 active listings. This is rather a lot if you are only selling 39 a month - 10 month's worth in fact.
Making this iBuyer business work is difficult in a down cycle. Even harder when you are a public company with all the SEC complications this brings. At times like this, being a spectator is probably preferable to being a participant. However if you are actively looking to buy a home, I think there are some real bargains to be found, especially among the Opendoor listings.
Sep 19 - Counting the number of listings under contract is a better way of measuring demand than counting closed listings. Both numbers give us information but the listings under contract count is more indicative of present circumstances, even though it is more uncertain. Listings can drop out of escrow at any point for a number of reasons.
Here is our daily chart showing the number of listings under contract for the last six months: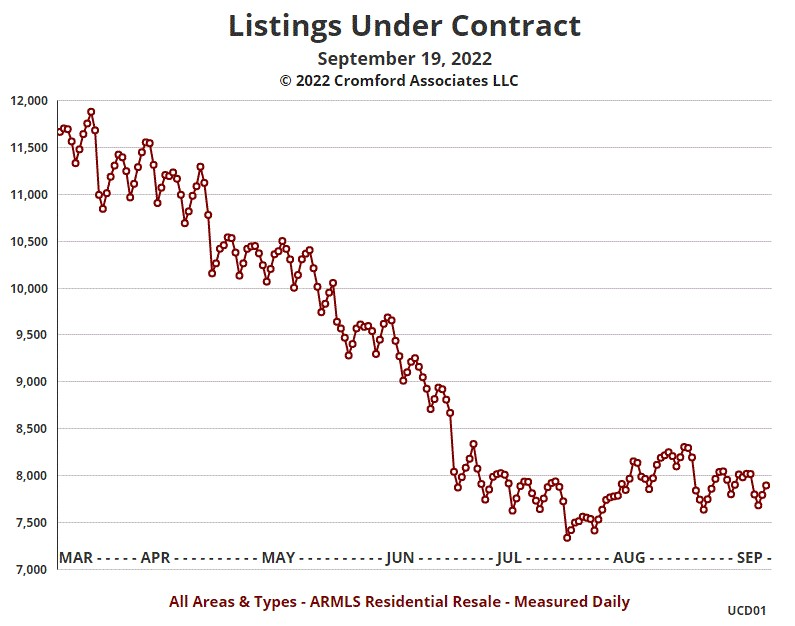
This tells the story quite well I think. Things were just peachy back in March with the under contract listing count at well over 11,500. April was a little worrying as they faded to around 11,000 but this this did not cause serious alarm unless you were a subscriber to the Cromford® Report. We raised the red flag of warning on April 24.
May through July saw a collapse in demand that can be clearly seen in the chart above. With interest rates rising, may buyers dropped out due to affordability and qualification problems.
August saw a mild recovery, probably due to the lower interest rates that appeared for several weeks. However now that they have surged well over 6%, the buyers are going on strike again and the listings under contract count is struggling to break over 8,000. This is a pretty low bar by historical standards and the apparent inability to stay above it is a worrying sign.
Sep 17 - We have long considered the Days of Inventory one of the best and most reliable indicators of the housing market. Please see the definitions section for a precise description of how it is calculated.
Below is the weekly chart for all areas & types within the ARMLS database.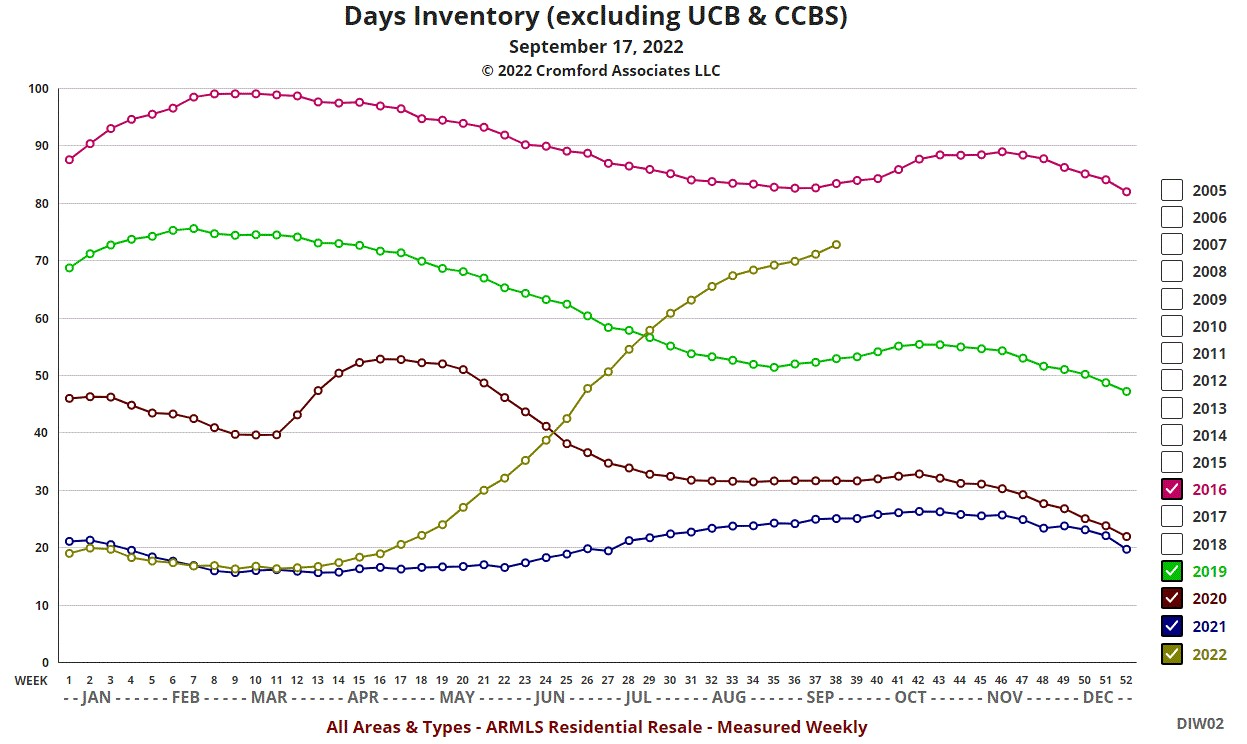
The market is strong when the days of inventory are low and weak when they are high. We like to use the annual sales rate to measure inventory because it is far less volatile than the monthly sales rate used when calculating months of supply.
In the chart we can see that the first indications of weakness in the market in 2022 came in April. The period from May through July shows rapid deterioration because active listings were growing very fast while the annual sales rate was falling. The deterioration slowed in August when active listings grew much more slowly, but the annual sales rate continued to drop.
We are now seeing signs that the situation is deteriorating again because the days of inventory has started to move higher at an increasing rate over the past 2 weeks. This is because higher interest rates are removing more buyers from the market. Our low number of new listings appears excessive relative to the present demand. Both are exceptionally low.
However, to put things in context, we have not yet reached the level of inventory we saw in September 2016, which was considered a normal year in which prices moved modestly higher. Nobody was too concerned in 2016, so why is there so much panic around now? There are several reasons:
1. We got used to very low inventory between 2020 and early 2022 and the current levels are much higher than we are now accustomed to. They feel higher than they are.
2. Social media is full of predictions of disaster because that is what attracts viewers and therefore rewards the person posting the bad stuff. People are primed to believe bad news more than good news.
3. The trends in 2016 were slowly improving whereas now they are slowly deteriorating. The latter feels much worse emotionally.
4. We have large inventories owned by the iBuyers and they are highly motivated to reduce them. This puts extra and unusual downward pressure on pricing.
Until a week ago, it looked as though the 2022 line could easily stay well below the 2016 line, bringing comfort to sellers and undermining the predictions of disaster. With interest rates above 6% things do not look so reassuring. It is now easier to imagine the 2022 moving above the 2016 line.
Even so, we don't see disaster as likely in the near term because the rate of arrival of new listings is so low. Collapses in price occur when inventory becomes excessive. In week 38 of 2007 we had 340 days of inventory. When considering the current 73 days of inventory it is a good idea to keep that number in perspective. It is still quite low compared with the long-term average, which is 117.
Sep 15 - Here is our latest table of Cromford® Market Index values for the single-family markets in the 17 largest cities
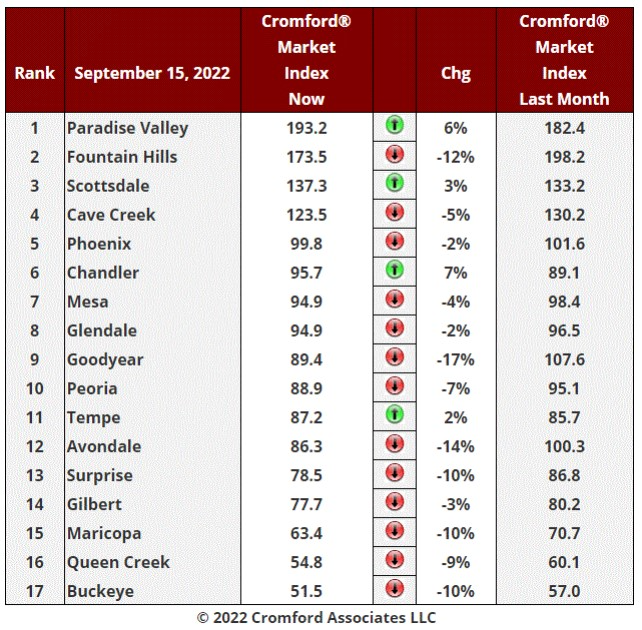
Sellers can again celebrate - the number of cities with an improved CMI over the past month has doubled again since last week. Scottsdale and Tempe have joined Chandler and Paradise Valley.
The average monthly change in CMI was -5%. This is another improvement on the week before when the reading was -9%. The deterioration has slowed markedly during the past four weeks and CMI readings are barely falling now. The average decline over the last week was only 0.1%.
The same 4 cities remain over 100. They are all relatively expensive parts of the market and all in the Northeast Valley. This market remains much stronger than the market has a whole.
Goodyear has slipped into a buyer's market below 90, so we now have a majority of cities in a buyer's market, even though the market as a whole is balanced. The contrast between the top and bottom cities is unusually large.
The bottom 3 cities continue to deteriorate for sellers because supply is high and still increasing.
Sep 14 - In several media reports, the rental market is said to be softening nationwide and we can certainly see some evidence in the local ARMLS data, even though the bulk of rentals are not handled through MLS listings. Landlords tend to us the MLS for more unusual rentals where clients can be more difficult to locate. This means they are usually skewed towards more expensive homes, and far more single-family detached homes are listed than apartments or condos.
The ARMLS data represents a small sample of what is available overall, but still provides us with useful data on what is happening in the rental marketplace.
Over the last 4 weeks we have seen a flood of new listings, with 66% more being added (2,952) compared with the same period last year (1,769). Clearly prospective tenants have far more choice with 3,445 active listings, the highest count in the last 7 years. This is up a massive 157% compared to this time last year. Something big is going on.
There is also a clear downward trend in the rents that are being advertised - currently the average is $1.55 per sq. ft. per month. This is down from $1.60 last month and $1.65 in mid July.
The rent for closed leases has been flat over the past 14 months, stuck at about $1.35 to $1.40 per sq. ft. per month. We anticipate that competition among landlords for the remaining prospective tenants is going to lead to more incentives and concessions. Once that these have worked through the system, actual rents for signed leases may start to decline.
This would be very helpful in lowering inflation and in turn this might encourage the Federal Reserve to stop raising interest rates. Although a 6% mortgage rate may seem quite low to people as ancient as me, who bought their first home in the mid 1970s, most people below the age of 40 consider it outrageously high. Young people these days! They don't know they're born.
Sep 12 - The monthly average $/SF for closed listings has behaved like this over the last 6 months: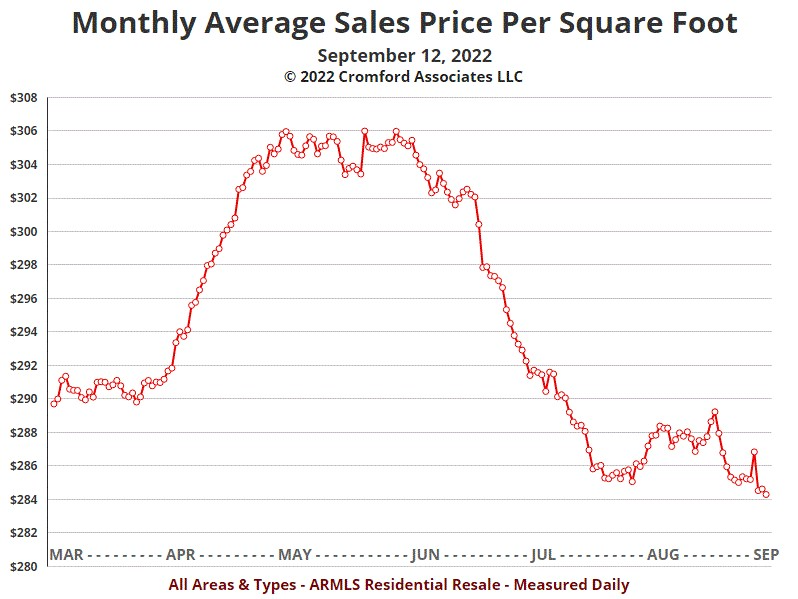
At just above $284, the current reading is just 2% below where it stood in mid March and there has been little movement since late July. The big jump up in April and the corresponding fall in July can be considered a mini-bubble and corresponding correction. The excessive exuberance has blown out of the market and with the CMI still over 100 and stable, there is no obvious reason for sales pricing to drop lower. That is, except for 2 problems:
1. Interest rates have moved higher over the past 2 weeks and could possibly move higher still, crippling the demand that had started to build while interest rates were closer to 5% than 6%
2. The sales volume has collapsed much more than the pricing.
It is not obvious why the second point should drive prices down. It certainly is bad news for people who depend on healthy sales volume for their income. This includes title company staff, real estate agents and mortgage lenders. However low sales volumes can be a big problem if there is too much inventory in the hands of owners who do not want to own it. This applies to banks after lots of foreclosures. This was the situation in 2006 through 2011, but it is not occurring now. There is very low REO inventory.
However we do have excessive inventory of empty homes in the hands of iBuyers. They continued to buy homes in large numbers during the second quarter and have ended up with far too many homes in their possession during the third quarter. These homes are empty and racking up expenses. Inventory has to be driven lower. The iBuyers are now in an analogous situation to the banks and GSEs in 2008. Excessive inventory can only be solved by disposal of the property. To achieve this the major iBuyer, Opendoor is cutting its prices dramatically. With lots of bargain homes on offer below market value, this is partially succeeding in moving homes from active to pending, but it also has the effect of a lowering average prices for the market as a whole. Opendoor is large enough to be a significant competitor for other sellers. This discounting also has the unpleasant side-effect of lowering the intrinsic value of the remaining unsold inventory.
So even though the CMI is currently stable at a comfortable level around 105, the heavy discounting by Opendoor could drive average pricing lower while it continues. We will look at this in more detail in future observations.
Sep 11 - The monthly average sales price is $549,861 while the annual average sale price is $550,701. This means the average home that closed between August 10, 2022 and September 9, 2022 was $840 cheaper than the average home that closed between September 10, 2021 and September 9, 2022. As recently as June the two averages were separated by almost $66,000, so the gap has dropped dramatically in less than 3 months.
It is never a good sign when the short term average is lower than the long term average. However this is not as uncommon as you might think. It happened briefly 5 weeks ago and also for 3 weeks in 2020 during the panic of the COVID-19 pandemic in late May and early June. We also saw the two averages intersect in September 2019, and during the Autumn of both 2015 and 2014. These were all periods of weak buyer confidence.
The dollar gap between the two averages is a good signal of the state of the market. A negative $840 number is not terrible but far from good. The highest we have ever measured was a positive $79,365 in May 2021 which we can look back on as following a peak in buyer optimism. The worst we have seen was negative $62,429 in March 2009. However reaching a peak and then falling back quickly is a positive signal that we are past the worst - by October 2009 the gap had closed completely.
It will be a more important sign if the short-term average stays below the long-term average for an extended time. A week or 3 is nothing to worry about, but several months means a long-term down-trend has started. This happened between September 2007 and October 2009. It would not be good to relive those years and at this stage it looks unlikely that we will.
Sep 10 - New listings are thin on the ground today in the residential re-sale section of the ARMLS database. However, the same can not be said of the residential rental section. We just recorded the largest ever year-over year percentage increase in the rate of new rental listings. We do not include short-term rentals in any of our numbers, only long-term residential leases.
We have recorded 2,916 new rental listings in the last 28 days which is up 60% from 1,826 this time last year.
Previous years were:
2020 - 1,963
2019 - 2,498
2018 - 2,343
2017 - 2,668
2016 - 2,733
2015 - 3,127
2014 - 3,512
2013 - 4,204
2012 - 3,924
We can see that 2,916 is not excessive by long-term standards, but is very high relative to the last 2 years and the highest for Sep 10 since 2015.
Clearly the rental market is going through some big changes if so many landlords are feeling the need to list their homes on ARMLS to find a tenant. In a strong rental market, most landlords don't bother, since they can usually find a tenant without going through the process of creating an MLS listing.
There were 3,449 active rental listings (excluding short-term rentals) yesterday. This is up 149% from the same date last year and up 15% from a month ago.
New renters have more choice than they had just a month ago and dramatically more than last year. They are also looking at an average listed rent of $1.56 per sq. ft. per month. It was $1.61 last month and $1.90 this time last year. We are not seeing the same downward trend in the average and median prices of leases signed, but the upward trend in these appears to have largely petered out over the past year. Any increase certainly seems to be lower than the current inflation rate.
The available rentals on ARMLS are dominated by single-family detached homes with a 74% market share. This is higher than this time last year at 65% and far higher than in 2020, when they comprised just 43% of active supply. Across the valley, single-family detached homes are much cheaper to rent than attached homes, when the lease price is adjusted for the sq. ft. of living space. Apartments are currently on offer at an average of $1.93 per sq. ft. per month, while townhomes are at $1.87 per sq. ft. per month. This change in the mix has contributed to the lowering of the average lease price per sq. ft. Condos, townhomes and apartments tend to be located more centrally which increases their price per sq. ft. Single-family detached homes are available for an average of $1.49 per sq. ft. per month, down from $1.91 this time last year. A large number of newly built single-family detached homes have been targeted at renters, increasing the available supply.
At least based on ARMLS asking prices, renting a single-family detached home has become more affordable in Greater Phoenix over the past year, while buying has become dramatically less affordable, partly because of higher asking prices, but mostly because of much higher interest rates. It should not be surprising that demand for purchasing homes is so weak, but it is surprising that the rental market appears to be losing demand, at least based on the average rents being asked.
Sep 8 - Here is our latest table of Cromford® Market Index values for the single-family markets in the 17 largest cities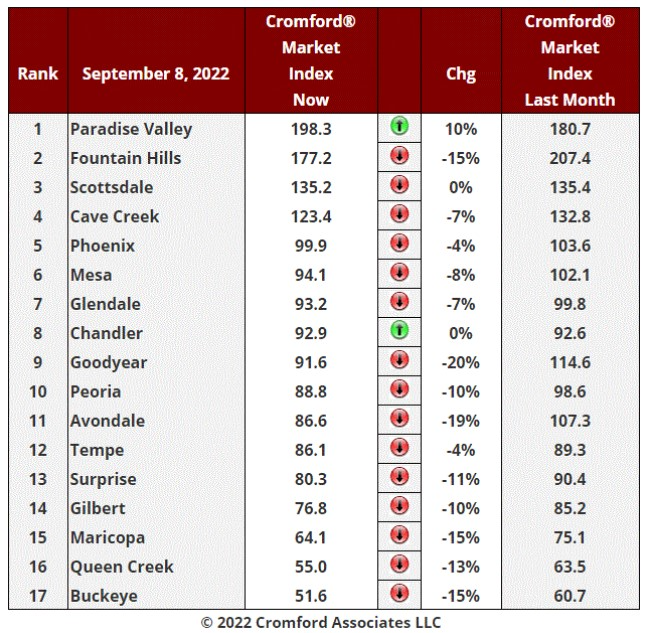
Sellers can celebrate - the number of cities with an improved CMI over the past month has doubled. Chandler has joined Paradise Valley, though its rise over the past 31 days has only been 0.3. Scottsdale almost made that same group be missed by only 0.2
The average monthly change in CMI was -9%. This is another improvement on the week before when the reading was -15%. The deterioration has slowed markedly during the past three weeks and CMI readings are falling much less quickly now. The average decline over the last week was only 0.2%.
Only 4 cities remain over 100. They are all relatively expensive parts of the market and all in the Northeast Valley.
If we focus on the change in CMI over just the past week, then more cities edged higher:
Chandler up 3.2%
Paradise Valley up 2.2%
Scottsdale up 1.9%
Tempe up 1.5%
Gilbert up 0.9%
Phoenix up 0.6%
Glendale up 0.3%
Mesa up 0.1%
There is no doubt that conditions are stabilizing, at least for now. The worst areas for CMI falling in the last week were:
Goodyear -3.0%
Fountain Hills -2.5%
Cave Creek -1.8%
Avondale -1.7%
Surprise -1.6%
Buckeye -1.3%
Maricopa -1.1%
The new found stability is because demand is very low but creeping higher while supply has almost stopped rising in most but not all areas.
Sep 7 - It is striking just how weak the closing numbers were for re-sale homes in Maricopa County during August.
First of all, August had the maximum number of working days (23) for title companies to close escrows. This is 15% more than July which only had 20 working days. So all other things being equal we could have expected 15% more closings than July, which gave us a feeble 5,920 re-sale transactions. Instead August saw just 5,784 re-sales, down 2.3%. So instead of a 15% increase we got a 2.3% decrease.
And this is comparing with a month that was already dismal. Comparisons with a strong month like August 2021 are far worse.
August 2022 had a 4.5% advantage over August 2021, having 23 working days to 22 last year. But closings dropped 38.3% year over year for re-sales. So sales per working day fell from 426 a year ago to 251 last month, a drop of 41%.
Things were far brighter in the new home segment. Here there were 1,635 closings, up 30.2% from July and up 7.5% from August 2021.
I cannot recall ever seeing a month like this before, with strong growth for new home closings and a collapse in re-sales.
Sep 6 - The Cromford® Market Index has plummeted from almost 500 to just above 100 over the past 5 months but has now reached a stable point: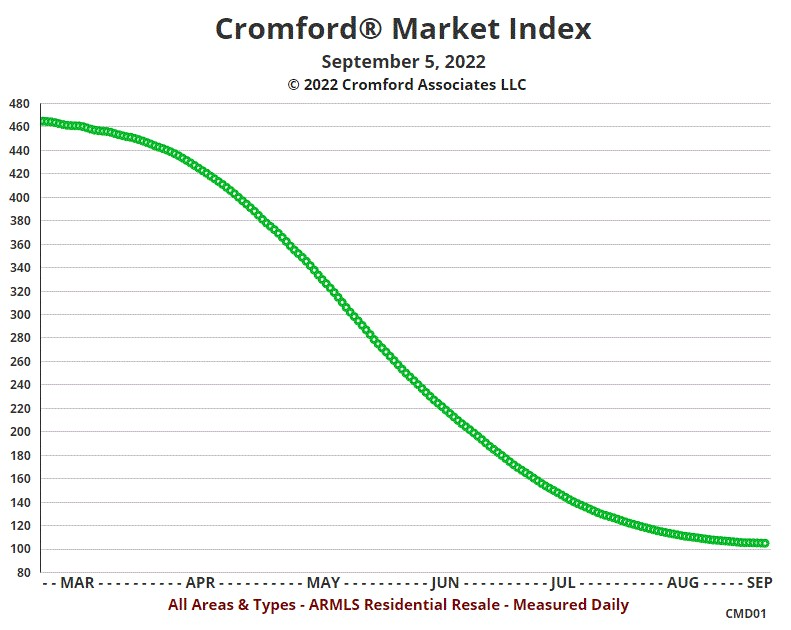
Things are no longer getting worse, at least overall. However, the CMI in Paradise Valley (195 and rising) is a lot healthier than the CMI in Buckeye (52 and falling). Taken as a whole, the market is balanced, but we have far too much supply on the outer edges and in the mid-range and far too little in the center of the valley and at the top and bottom of the price ranges.
There is no guarantee that having achieved stability, the market will be able to sustain it. Interest rates may yet create more havoc, moving sharply higher or lower. Given the stance of the Federal Reserve, higher is far more likely than lower, but nobody has ever proven consistently successful predicting interest rates.
Sep 5 - Institutional investors are losing their enthusiasm and their purchases in Maricopa County dropped from 579 in July to 307 in August. This means they halved their market share from 8% to 4%.
iBuyers too are trying to curtail their purchases but because many offers were already accepted they still bought more homes (296) in August than they sold (216).
In August the biggest winners were the home builders. More than 1 in 5 homes purchased was brand new, the highest market share for new builds since March 2008.
Demand is weak across the board, but supply is not growing like it did when demand started to falter in 2005. The period of rapid supply growth appears to have ended in early August.
Sep 3 - August was another quiet month fro closings so the affidavit counts are easier than usual. Here is what we found in Maricopa County:
There were 1,635 new homes closed with a median price of $513,890. The unit count is up 7.6% from August 2021 and the median sales price is up 22%
There were only 5,784 re-sales closed with a median price of $450,000. The unit count is down a massive 38% from August 2021 and the median sales price is up slightly less than 10%
Overall there were 7,419 closings with a median price of $466,990. The unit count is down 32% and the median price is up 13.5%
We can see that closings were relatively strong in new homes and they comprised 22% of all closings in August, up from 14% a year ago. The new home median is slightly lower than last month but not significantly so. These prices were set many months ago when contracts were signed under much more favorable market conditions.
In the re-sale market prices are set much closer to closing and the median price is therefore much weaker, having dropped 7.4% since peaking in May. At $450,000 the median price for re-sales is back where it was in February. The closing count is the weakest monthly total since January 2016.
Sep 1 - Here is our latest table of Cromford® Market Index values for the single-family markets in the 17 largest cities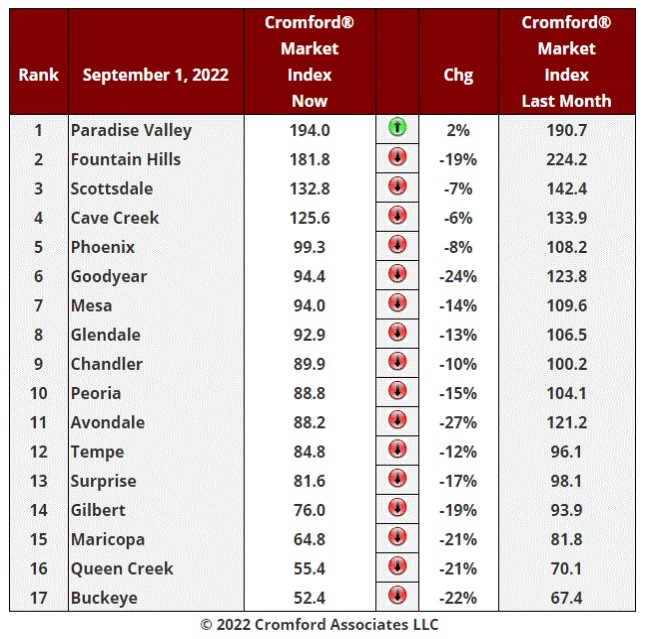
The average monthly change in CMI was -15%. This is another improvement on the week before when the reading was -20%. Although we are still seeing a deterioration for sellers over the last month, most of that happened in the first two weeks (that is, the first half of August). The deterioration has slowed markedly during the second half of August and CMI readings are falling much less quickly now. The decline over the last week was only 1.2%. We also have our first city showing an improvement for sellers over last month - Paradise Valley. Carefree also looks healthier, but is far too small an area to generate the numbers we can use to create a CMI.
Only 4 cities remain over 100. They are all relatively expensive parts of the market and all in the Northeast Valley.
If we focus on the change in CMI over just the past week, then a few other cities edged higher:
Scottsdale up 1%
Chandler up 2%
Tempe up 0.1%
Falling most in the last week were Goodyear and Avondale, both down 4%.
The luxury market remains under-supplied and although the market is far weaker than it was 6 months ago, it remains healthy because there is less supply than demand, even with the much higher mortgage rates. It is also true that the very low-end of the market has weak supply so prices are firmer for the few homes still under $300,000.
It is the mid-range between $300,000 and $1.5 million that is seeing the most difficult conditions for sellers, particularly in the more-far-flung areas where new homes are available in larger volumes. The weakest markets are in Buckeye, Maricopa and the San Tan Valley. The latter area has no consistently defined boundaries with subdivisions being incorporated into the town of Queen Creek one by one. For this reason, we include San Tan Valley in Queen Creek for statistical purposes. To do otherwise would introduce statistical errors we cannot tolerate.
Supply is only rising slowly and is even falling in a few areas. Demand remains weak, but has picked up over the past three weeks. It remains sensitive to interest rate changes, so this revival in demand could easily peter out if rates jump higher again.
Overall, the picture is less gloomy at the start of September than we expected at the beginning of August. For that we can all be thankful.
Aug 30 - The latest S&P / Case-Shiller® Home Price Index® numbers were published on August 30.
The new report covers home sales during the period April to June 2022. This means they are just starting to reflect some of the weakening in the market, but because they do not include any sales closed after July 1, 2022, most of the price weakness we have experienced over the past two months is yet to appear.
Comparing with the previous month's series we see the following changes:
1. Miami +2.34%
2.Tampa +2.16%
3. Charlotte +1.76%
4. Chicago +1.76%
5. Las Vegas +1.48%
6. Atlanta +1.31%
7. Cleveland +1.24%
8. New York +1.07%
9. Phoenix +1.04%
10. Dallas +1.02%
11. Detroit +0.87%
12. Minneapolis +0.72%
13. Boston +0.62%
14. Washington +0.01%
15. Denver -0.08%
16. Portland -0.08%
17. Los Angeles -0.35%
18. San Diego -0.66%
19. San Francisco -1.32%
20. Seattle -1.89%
Phoenix has moved down from 4th to 9th place but remains well above the national average, which was +0.59%.
Six of the 20 cities saw month-to-month declines in their index, with the west coast being badly affected.
Comparing year over year, we see the following changes:
1. Tampa +35.0%
2. Miami +33.0%
3. Dallas +28.2%
4. Phoenix +26.6%
5. Charlotte +25.5%
6. Las Vegas +25.1%
7. Atlanta +24.8%
8. San Diego +21.6%
9. Los Angeles +19.3%
10. Denver +19.3%
11. Seattle +19.2%
12. San Francisco +16.1%
13. Boston +14.9%
14. Portland +14.7%
15. New York +14.6%
16. Detroit +13.2%
17. Chicago +13.1%
18. Cleveland +12.8%
19. Washington +10.8%
20. Minneapolis +10.4%
Phoenix is in 4th place and far exceeded the national average of 17.6%.
Aug 29 - Back on August 8 we said that the gap between the average $/SF for listings under contract and the average $/SF for closed listings was too large. This gap has now reduced substantially as you can see from the chart below: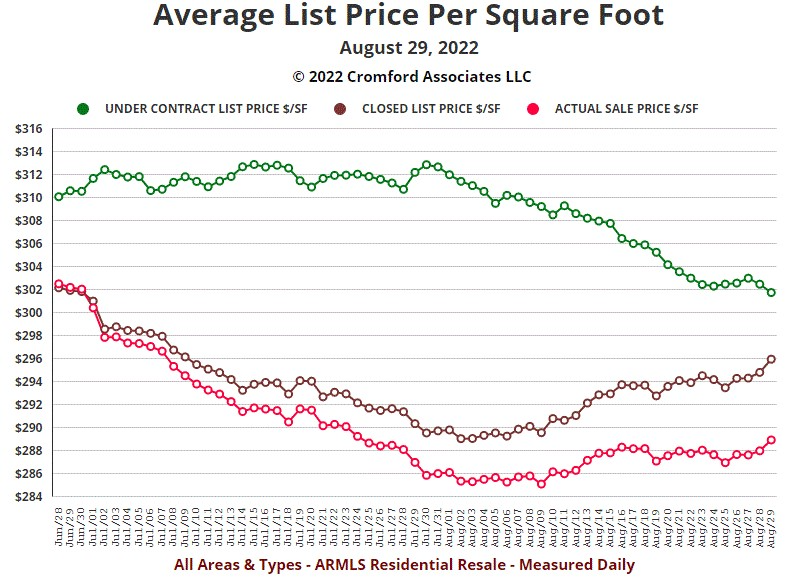
There are two pieces of bad news for sellers and one piece of good news in this chart. The good news is that the average list price $/SF for closed listings has increased over the past 4 weeks from around $289 to $296. This is not consistent with the idea that the market is crashing.
The first piece of bad news is that the achieved sales prices have dropped further below the final list prices and so the average sale price $/SF has only advanced from around $285 to $289. This is much less than the increase in the list price $/SF. This modest rise is much better than a decline, but it confirms that sellers' negotiation power is far weaker than it has been for many years.
The second piece of bad news is that the average $/SF for listings under contract has descended from over $312 to below $302 during the same 4 weeks. Unless this starts rising again, the brown line is not going to be able to sustain its current rising trend. It would be very unusual for the green line to drop below the brown line. So if the green line continues its decline, the brown line must turn around.
Aug 28 - The listing success rate for all areas & types is down to 70.4%, which is the lowest we have seen for late August since the year 2010. Mind you, in 2010 the reading was a dismal 58.1% thanks to all the short sales and pre-foreclosures crowding the market at that time.
Any new sellers need to be realistic. 30% of listings fail to sell these days. At the end of March the percentage was less than 8%. Listing agents now need to focus on marketing instead of worrying about how to handle the deluge of offers in the first few days.
Another sign that the times have changed is that Coming Soon listings are declining in number. It is no longer a matter for great excitement that your home is shortly to be listed for sale.
Welcome to normality!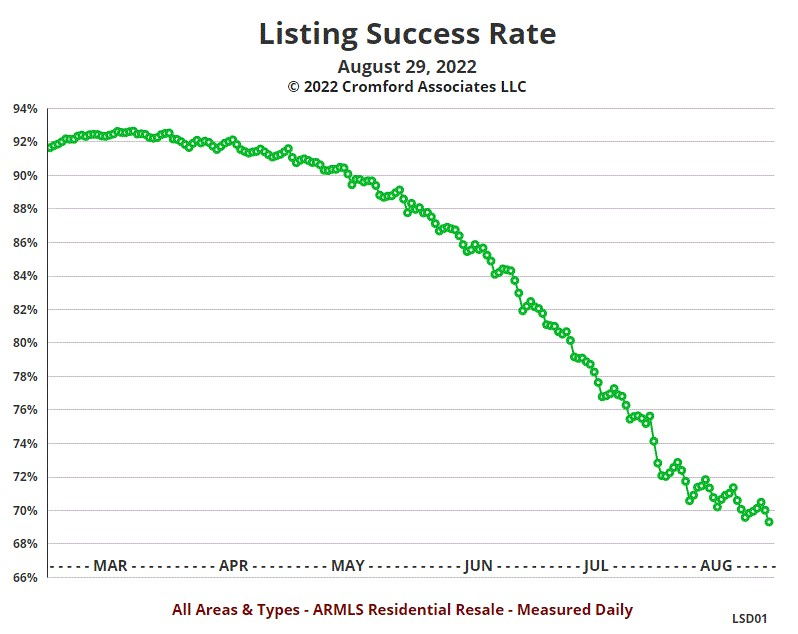
Aug 27 - Fewer single-family permits are being issued in Maricopa and Pinal counties. As builders scale back their plans, we counted only 1,960 single-family permits issued in July 2022. This is the lowest monthly count since May 2020, when the COVID-19 pandemic was disrupting all business. The current total is 35% lower than July last year.
No similar reticence applies to the multi-family developers. July 2022 saw the largest total of multi-family permits we have ever recorded, namely 2,546. This is up 45% from July 2022 and the first time we have seen multi-family permits exceed single-family permits. The July year-to-date total is 11,186, which smashes the previous record of 9,008, set in 2020.
Developers appear to think there will be a lot more people renting in denser urban areas in the future.
Aug 26 - The flow of new listings has eased substantially over the past few weeks. As recently as June 26, we reported a record weekly total of 3,169, which was the culmination of an elevated arrival rate that had lasted since April 26. However this eased in July to a more normal 2,700 per week and during August it has fallen well below normal to reach 2,224 as of today.
This is down 9.7% from the same week last year and down 5.2% from the same week in 2020. New supply can be properly described as weak now, so rather appropriate for a market with weak demand, as we have been experiencing over the last several months.
If new supply stays low, then we are unlikely to see the sharp increases in active listing counts that we have reported between April and July. In fact if demand picks up a bit, supply could start to retreat again. The first sign of this would be counts that fall when comparing the same weekday 7 days earlier. This is not yet occurring for the market as a whole, but several segments are seeing a small drop in active listings comparing today with a week ago. This includes:
apartment-style dwellings
townhomes
single-family detached in:
Chandler
Gilbert
Glendale
Mesa
Peoria
Scottsdale
Tolleson
Of course interest rates could rise again and take the wind out of the sails. But at the moment, overall demand is improving and in the more central parts of the valley such as Phoenix, Tempe and the cities above, it would not be surprising to see the market balance move towards sellers over the next several weeks. The outer areas are more likely to remain weak for sellers, with additional supply coming from new home developers all the time and a stronger flow of new re-sale listings from investors and iBuyers.
Aug 25 - Here is our latest table of Cromford® Market Index values for the single-family markets in the 17 largest cities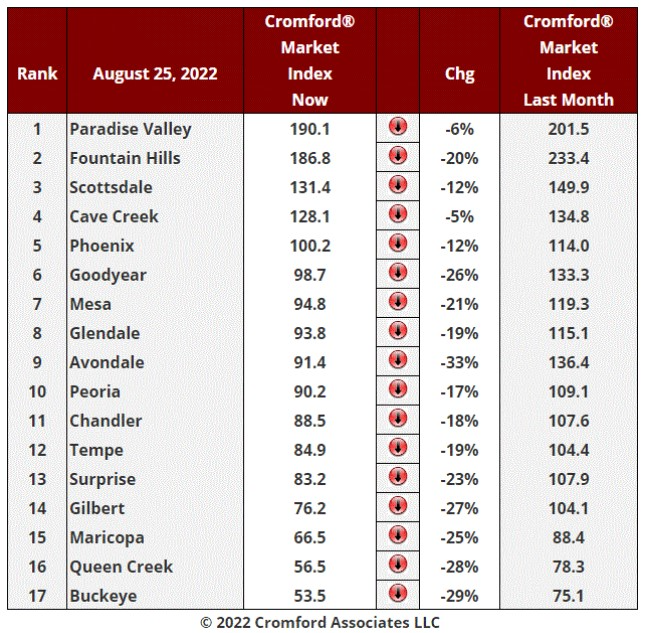
The average monthly change in CMI was -20%. This is another improvement on the week before when the reading was -25%. Although we are still seeing a deterioration for sellers over the last month, most of that happened in the first two weeks (that is, late July and early August). The deterioration has slowed markedly during the middle of August and CMI readings are falling much less quickly now. The decline over the last week was only 2.5%.
A few cities are even seeing their CMI rising in the last few days, including Paradise Valley, Chandler and Tempe. This is the first significant silver lining to the dark clouds that have hung over the market since April.
Demand has picked up in some areas, in the shape of increased numbers of listings going under contract. This is most noticeable in Chandler, Mesa, Phoenix, Tempe and Paradise Valley but has also occurred to a smaller extent in Glendale, Gilbert and Surprise.
In addition to improving demand, new supply has weakened to below normal. Only a few weeks ago, new listings were arriving at a very fast pace, but this seems to have subsided now.
Some areas remain heavily balanced in the buyer's favor, but overall, the market looks ready to settle into a more stable situation if current trends persist.
Paradise valley has overtaken Fountain Hills to make number one in our table. The top 4 slots are occupied by the 4 most expensive of the 17 cities.
Aug 22 - There is currently an interesting difference between the strategies of the two main iBuyers in the Greater Phoenix area.
Opendoor has roughly 2,520 homes in inventory and only sold 151 in July. That means they have almost 17 months of inventory. Holding costs start to mount when you have that much in stock, to say nothing of the interest on the money tied up. You can see that they are motivated to sell, because they are disposing of many homes well below cost and giving some buyers substantial closing concessions.
For the 47 homes sold since August 10, the average gross profit made (the difference between the purchase price and the sale price) was -4.4%. The average concession was 0.61% and the average buyer broker's compensation was 2.24%. This means an overall gross margin of -7.25%. This does not allow for the fee charged to the seller, which is not public information.
In the same period we saw only 7 sales by OfferPad, since they seem to be less willing to take a write-down on their homes for sale. We calculate that they have roughly 495 homes in inventory, which represents 11 months of supply at their July sales rate of 45. However this strategy means their sales volume in August is very low. The average profit made on homes that sold since August 10 is more healthy at +5.8%. They are being more generous with their buyer broker compensation at an average 2.75% and less generous with their buyer concessions at 0.27%. Overall their gross margin stands at about +2.8% - still positive.
So based on affidavits filed since August 10, OfferPad are making positive gross margins but not recording many closings. Opendoor are closing far more but are doing so by accepting substantial negative gross margins.
OfferPad is achieving an average 95.7% of their original list price while Opendoor is only achieving 87.9%. This is because Opendoor cuts prices more aggressively and more frequently. Their average hold time is 130 days and average days on market is 76. OfferPad has an average hold time of 105 days and 63 average days on market. These figures only count homes that closed, not homes that are for sale or in escrow.
We see signs that both iBuyers are getting far less aggressive with their buying and expect to see them get far more aggressive with their selling.
With over 3,000 homes owned and almost 2,100 active listings, the iBuyers represent 11% of the active listings on ARMLS. They only represent 3% of ARMLS closings. They will probably be trying to get those percentages to be closer to each other in future.
Aug 21 - The bad trends for sellers that have prevailed since April appear to be running out of momentum.
New listings have dropped sharply over the past few weeks, with fewer than 10,000 appearing in the last 28 days. The peak was 12,246 per 4 weeks (on June 28) and the last time we had fewer than 10,000 was April 21. The 4-week count is down 2.7% compared with the same time in 2021. The weekly total is 9% below last year so this downward trend in new supply appears to gaining strength. A shortage of new supply is great news for sellers, though with demand so low, we are still seeing a slight build-up in available inventory.
However, demand is showing signs of life at last - not in the sales counts which will remain awful for some time - but in the rate of listings going under contract. In the 7 days that started on Sunday August 7, we saw 1,803 newly accepted contracts. This is the highest weekly total since June 12 and far more encouraging than the dismal 1,429 for the week beginning July 3.
We would describe these developments as the first signs of a possible improvement in market conditions.
Aug 20 - The rate of arrival of new listings continues to drop while demand has stabilized at a subdued level. This means we are seeing only a modest rise in active supply - up only 132 in the last week. The is less than half the rise during the previous week and dramatically lower than a month ago.
Some cities have even seen supply fall during the last 7 days, including Fountain Hills, Cave Creek, Maricopa, Chandler, Glendale and Tempe.
This new trend, if it continues, will substantially reduce the recent downward pressure on pricing.
Aug 19 - The overall market (all areas & types within the ARMLS database) has seen its Cromford® Market Index fall below 110. This is the first time the CMI has dropped below 110 since February 17, 2015.
We officially declare the market to be balanced. It will remain so while the CMI lies between 90 and 110.
Things vary a lot between segments however. Locations such as Surprise, Gilbert, Tempe, Maricopa, Litchfield Park, Buckeye, Queen Creek & San Tan Valley are buyer's markets, while Fountain Hills, Paradise Valley, Scottsdale and Cave Creek are seller's markets.
Aug 13 - Tina has returned from a short fishing trip to Alaska and is now available and connected to the internet. However, Mike is about to leave the office for a memorial event for his mother who died last year amid the strongest COVID-19 lock-down restrictions. Daily observations will be limited until August 20 and some of the charts will take longer to update than usual, especially the city charts that are updated weekly on Thursdays. Normal service will resume on August 20.
Aug 12 - For reasons that are not clear to me, a handful of brokerages have been cancelling listings in bulk and then re-listing the same information with a new MLS number over the past 6 weeks. This increases the number of cancelled listings, reducing the listing success rate and also makes the number of new listings higher. The practice has added about 8 to 10% to the cancel count and added about 1.5% to the new listings count. Since cancelling and re-listing does not reduce the days on market, I am wondering what the motivation is. Statistically, it makes the market look a bit weaker than it actually is. However the numbers are not large enough to make the distortion too serious for the overall market. However, the specific brokerages involved will have unusually poor listing success rates.
Aug 11 - Here is our latest table of Cromford® Market Index values for the single-family markets in the 17 largest cities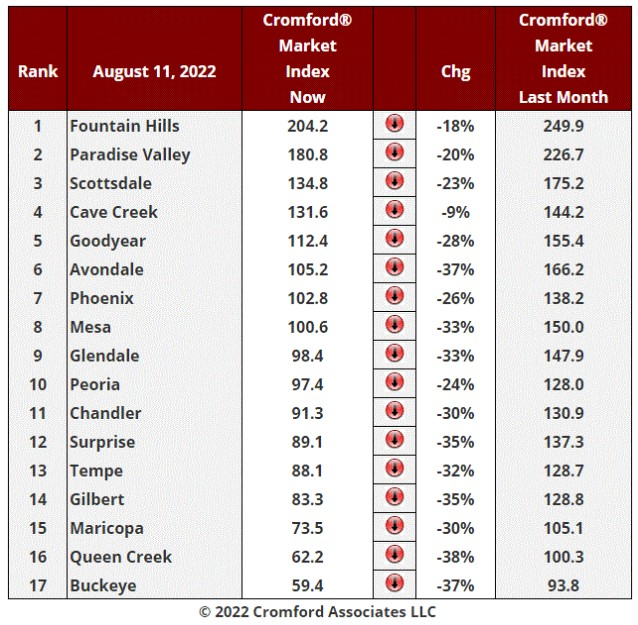
The average monthly change in CMI was -29%. This is another slight improvement on last week when the reading was -31%. Once again it is a large deterioration in a very short time, but there are more signs that the trend is slowing at last. Supply is growing more slowly and in a few areas has stopped growing entirely, at least for a moment. Demand is still very weak, but in a few areas it is stabilizing or even increasing slightly.
In the last week we saw an average change in CMI of -5.7%, and all 17 cities still declined. But if the negative weekly decline continues to reduce, we will eventually find one or more cities showing some improvement.
We have 6 cities in a buyer's market - Surprise, Tempe & Gilbert have joined Buckeye, Queen Creek and Maricopa. The reduced number of buyers now have a strong negotiating advantage with a large number of active listings to select from. However this negotiating power is not yet universally reflected in weaker closed prices. In particular, Queen Creek (which includes San Tan Valley) is maintaining strong closed price numbers, especially considering how unbalanced demand and supply have become. This is unlikely to last.
Above these 6 we have Chandler, Peoria, Glendale, Phoenix, Mesa and Avondale in a balanced market where the buyers and sellers have no particular advantage. This leaves 5 cities that are statistically in the seller's market zone with a CMI over 110. Only one of these is a large market - Scottsdale. One of them (Cave Creek) saw a relatively modest decline in their CMI over the last month of 9%.
The bottom 13 cities saw CMI declines of 24% or more but now there are none worse than -38%. The housing market is still deteriorating for sellers but it is getting worse at a significantly slower rate.
The top four, Fountain Hills, Paradise Valley, Scottsdale and Cave Creek are in a stronger position with supply still less than demand. However, Scottsdale prices have reacted more swiftly than the low-priced areas and averages and medians are weaker than you might expect. This pattern does not apply to Fountain Hills, which is not only still over 200 but is seeing very few signs of price weakness.
Aug 10 - The arrival rate of new listings has subsided over the past month and we are now seeing active listings grow at a slower rate than in July.
There were 10,747 new listings in the last 4 weeks, up 5.6% from the same period in 2021. However in the last 7 days we counted 2,544 new listings, down 5% from the same week in August 2021. Quarter-to-date we have 4% more than last year and 12% more than 2020, but if this slight lull persists, we could see the market move closer to stability rather than a continuing decline.
Active listing counts (excluding UCB and CCBS) are still rising because of weak demand, but the rate of increase has fallen to about 500 per week, instead of the 1,000 per week we were experiencing a month ago. The most recent peak was late June when we almost reached 1,500 per month.
If we were to see a decent recovery in demand, then these 500 per week could get absorbed and the supply situation could stabilize. This would ease the downward pressure on prices.
Of the 500 increase, the bulk (400) are single-family detached homes. About 50 are townhomes, 30 are apartments, 20 are mobile homes, with just a handful of other dwelling types.
Aug 8 - The daily chart showing average list price per sq. ft. is showing massive changes over the past 2 months.
Note that the red line (monthly average sales price per sq. ft.) was 1.26% HIGHER than the monthly average list price per sq. ft. for closed listings on June 7. This has plummeted to 1.48% BELOW list on August 8. Although average sales prices have declined substantially since the beginning of July, the average $/SF for listings under contract (the green line) has not. We are just starting to see the green line display a little weakness, but at the same time the red line and brown line are showing a corresponding resistance to gravity.
The gap between the green and brown lines is much wider than normal, so we would expect this gap to narrow in the coming weeks. Either the green line should fall or the brown line should rise, or maybe a bit of both. This market is certainly not boring.
Aug 7 - Most people are familiar with the idea of "months of supply". One way to explain it is to say it represents how long it would take to sell all the available inventory at the current monthly sales rate if no new listings came onto the market. The longer it takes the cooler the market. Obviously it will tend to increase when the number of available active listings rises. It will also tend to increase when the monthly sales rate falls.
It is important to decide what we are going to include among the active listings. If we include the UCB and CCBS listings (which are technically still active and accumulating days on market), then for a normal everyday location a typical number of months of supply for a balanced market is 4 to 5 months. If we exclude the UCB and CCBS listings (since they are already in escrow with a signed contract), then the typical number is 3 to 4 months.
The numbers tend to be much higher for an expensive market. A normal balanced number for Paradise Valley is 12 to 15 months. For Scottsdale it is 6 to 7 months, for Gold Canyon 7 to 8 months, Cave Creek is 6 to 7 months and Fountain Hills 7 to 8 months. These are excluding UCB and CCBS listings.
Here is where the single-family detached months of supply for major and secondary cities stand at the moment. The numbers in parentheses are the reading for August 2021.:
1. Paradise Valley - 10.2 (3.5)
2. Buckeye - 4.4 (1.1)
3. Scottsdale - 4.4 (1.6)
4. Queen Creek - 4.3 (1.1)
5. Litchfield Park - 4.2 (1.3)
6. Gold Canyon - 4.2 (2.0)
7. Maricopa - 4.1 (1.2)
8. Fountain Hills - 4.1 (2.1)
9. Cave Creek - 3.9 (1.1)
10. Surprise - 3.9 (1.0)
11. Apache Junction - 3.5 (1.1)
12. Sun Lakes - 3.4 (0.9)
13. Anthem - 3.4 (1.0)
14. Chandler - 3.3 (1.0)
15. Gilbert - 3.3 (0.9)
16. Tolleson - 3.3 (1.1)
17. Phoenix - 3.2 (1.1)
18. Mesa - 3.2 (1.0)
19. Tempe - 3.2 (1.1)
20. Casa Grande - 3.1 (1.5)
21. Glendale - 3.0 (1.0)
22. Goodyear - 3.0 (1.0)
23. Avondale - 2.9 (0.9)
24. Peoria - 2.9 (1.0)
25. Sun City West - 2.8 (0.7)
26. Laveen - 2.7 (1.0)
27. Arizona City - 2.6 (1.4)
28. Sun City - 2.5 (1.0)
29. El Mirage - 2.0 (0.6)
These figures include the UCB and CCBS active listings. They have clearly moved from extremely low in August 2021 to more normal values in August 2022. However, none of them are yet excessive compared with their long-term averages. Buckeye, Queen Creek, Maricopa, and Litchfield Park are the coolest cities, which corresponds with their CMI readings. We give a pass to Paradise Valley, Scottsdale, Cave Creek Fountain Hills, and Gold Canyon, since their "normal" months of supply are higher than their current readings.
Aug 6 - The closed transaction counts for July were unusually low, but the drop was different for the various categories of sales. Below are the counts compared with July 2021 showing the percentage changes. These numbers are for Maricopa County only and include single-family and townhouse/condo properties.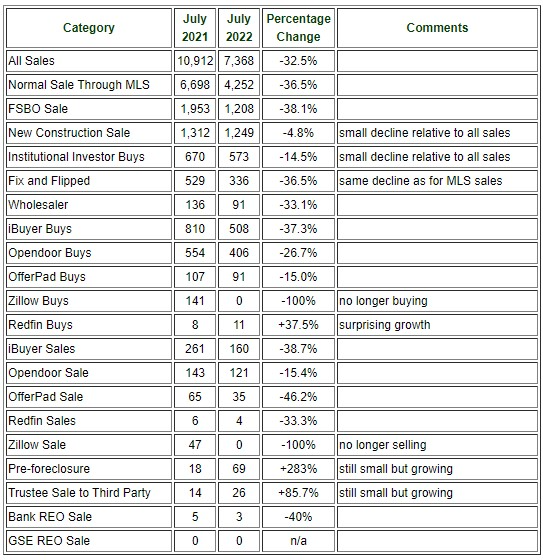
Between them, iBuyers and institutional investors represented almost 15% of the purchases, but only 2% of the sales.
Aug 5 - Here is our latest table of Cromford® Market Index values for the single-family markets in the 17 largest cities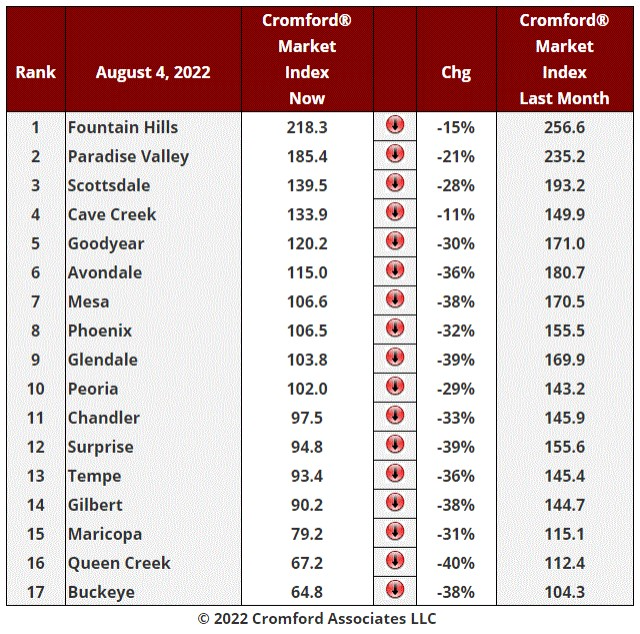
The average monthly change in CMI was -31%. This is a slight improvement on last week when the reading was -32%. Once again it is a very large deterioration in a very short time. New listings have slowed down to a normal level. However a normal quantity of new listings is far more than the market can cope with, when demand is as weak as it is at the moment. Demand is falling at a slower rate and is even rising in a few places. However it is currently so far below normal that in most areas it will take a large increase to get back to the level where it can absorb a normal quantity of new listings.
We have 3 cities in a buyer's market - Buckeye, Queen Creek and Maricopa - the same as last week. In all three, the reduced number of buyers now have a strong negotiating advantage with a large number of active listings to select from.
Above them we have Gilbert, Tempe, Surprise, Chandler, Peoria, Glendale, Phoenix and Mesa in a balanced market where the buyers and sellers have no particular advantage. This leaves only 6 cities that are statistically in the seller's market zone with a CMI over 110. Only one of these is a large market - Scottsdale. Two of them (Fountain Hills and Cave Creek) saw relatively modest declines in their CMI over the last month of 15% or less.
The bottom 13 cities saw CMI declines of 29% or more but at least there are none over 40%. The housing market is still deteriorating for sellers but it is getting worse at a slower rate. This is particularly true of Phoenix itself. The next stage we are looking out for is for one or more of these cities to stop deteriorating and edge higher. This means their arrow circle will turn green and point upward. April 21 is the last time we had one or more cities showing green.
Gilbert, Tempe and Surprise look ready to become buyer's markets within days, while Avondale and Goodyear are likely to move into the balanced zone shortly.
Aug 4 - A useful way of measuring how hot the market is is the contract ratio (see definitions section for how it is calculated).
The overall market for all areas and types has seen its contract ratio decline from a high of 285 as recently as February 23 to 46 as of August 3. We usually consider the range 30 to 60 as being normal, with figures over 60 being unusually hot and those under 30 being unusually cold. The high-end sectors tend to have much lower contract ratios so 15 to 30 can be considered normal for an area like carefree or Paradise Valley.
If we look for ZIP codes where the single-family detached market is unusually cold right now we find a few very small ZIP codes with no contracts at all::
Fort McDowell 85264
Arlington 85322
Black Canyon City 85324
The sales volumes are so small in these ZIP codes that having no contracts is not so unusual, so we exclude them from our analysis.
The following have some contracts, but low contract ratios indicating cold markets where buyers have an advantage over sellers. The contract ratios are shown in parentheses.
These are our top 20 targets for buyers:
1. Mesa 85215 (20)
2. Phoenix 85003 (20)
3. Phoenix 85007 (20)
4. Superior 85173 (20)
5. Tempe 85283 (24)
6. Scottsdale 85257 (25)
7. Casa Grande 85193 (25)
8. Casa Grande 85194 (25)
9. Phoenix 85045 (26)
10. Scottsdale 85258 (27)
11. Phoenix 85015 (27)
12. Litchfield Park 85340 (27)
13. Phoenix 85020 (27)
14. Phoenix 85048 (27)
15. Wittmann 85361 (28)
16. Scottsdale 85251 (28)
17. Anthem 85086 (28)
18. San Tan Valley 85140 (29)
19. Phoenix 85009 (30)
20. Phoenix 85044 (31)
We note that Ahwatukee is prominently featured in this list with all 3 of its ZIP codes (85044, 85045 and 85048), so as I buyer I would feel free to flex my negotiating muscles if shopping for homes in Ahwatukee.
At the other end of the scale there remain a few ZIP codes where the contract ratio remains relatively high (60 or more), including:
1. Arizona City 85123 (156)
2. Tempe 85284 (96)
3. Eloy 85131 (94)
4. Phoenix 85054 (86)
5. Mesa 85203 (83)
6. Casa Grande 85122 (72)
7. Phoenix 85053 (72)
8. Mesa 85201 (71)
9. Phoenix 85027 (65)
10. Coolidge 85128 (60)
11. Gold Canyon 85118 (60)
12. Mesa 85204 (60)
Pinal County is strongly featured in this list, especially the areas around Casa Grande, Eloy and Arizona City. I would not expect such an easy time as a buyer in the ZIP codes on this (admittedly short) list.
Segmenting by price, we see that the contract ratio for single-family homes priced below $350,000 is still over 60, so this market retains some strength. However prices have risen so much over the past 2 years that this segment represents only 4.5% of the total market.
The contract ratio for homes priced between $350,000 and $400,000 is 59, so at the top end of normal. But for homes over $400,000 and up to $1.5 million we now see contract ratios between 35 and 41. This is at the colder end of normal and the trend is strongly downward. This price range represents 82.4% of the market with $400,000 to $800,000 dominating with a 55.5% market share. This huge segment is where buyers are starting to gain the upper hand.
Over $1.5 million, contract ratios are in the mid-thirties, which is actually higher than usual. Demand has dropped significantly in this price range but supply remains quite low. The luxury market is very quiet, even for August which is always a very slow month, but the low supply means buyers do not have as much bargaining power as they enjoy below $1.5 million.
Aug 3 - The July affidavits in Maricopa County showed a significant reduction in demand from investors.
Of the 7,175 closed transactions, only 18.9% were marked as intended for renting to a third party. The same percentage in June was 22.1%.
In unit counts, purchases to be used as rentals fell by 35% from 2,094 in June to 1,355 in July.
This is a second wave of demand reduction. The first wave was caused by much higher interest rates discouraging buyers for their own occupation. The buyers leaving in the second wave are less affected by interest rates since they mostly pay cash. They are probably getting discouraged by the new direction the market has taken since April.
Aug 2 - One positive consequence of home sales being so low is that it does not take long to count them. We already have the Maricopa County affidavit numbers for July and they look like this:
There were 7,175 closed home sales during July. This compares very unfavorably with July 2021 when we had 10,720. The year-over-year decline in sales is 33%.
The median sales price was $475,000, down from $486,824 in June but up from $409,468 in July 2021. The year-over-year increase in median sales price is 16%, down from 22% last month and 25% in May.
There were 1,256 closed new home sales during July. This is down from 1,316 in July 2021. New home sales are down less than 5% year-over-year
The median sales price for new homes was $516,842, up from $500,454 in June and up 23% from $419,618 in July 2021.
There were 5,919 re-sales during July. This is down 37% from 9,404 in July 2021
The median sales price for re-sales was $464,000 in July, down from $484,000 in June and the lowest median sales price since February 2022. It is up 15% year-over-year however.
Re-sales react far more quickly to changing market conditions because the time between contract signature and closing is much shorter than for new homes. This is especially true in 2022 because of extended lead times on new homes due to shortage of skilled labor and supply-chain problems with many building products.
The re-sale numbers are worse than anticipated with a huge drop in closed volumes and a large fall in median price of $20,000, over 4% in just one month. The new home numbers are better than expected with a new high being reached in the median sale price and only a small drop in units closed.
An optimist might hope for a bounce back in August, but with listings under contract down 6.5% compared with the beginning of July, this is looking unlikely.
Re-sale home prices are clearly falling which would normally increase demand, but if buyers think they will fall further, their motivation is likely to be low. However falling home prices will ultimately help with getting inflation under control. That is a prerequisite to the Federal Reserve halting their program of regular increases in federal funds interest rates.
Aug 1 - The average sales price per square foot for closed listings dropped sharply between June and July, as shown in the daily chart below: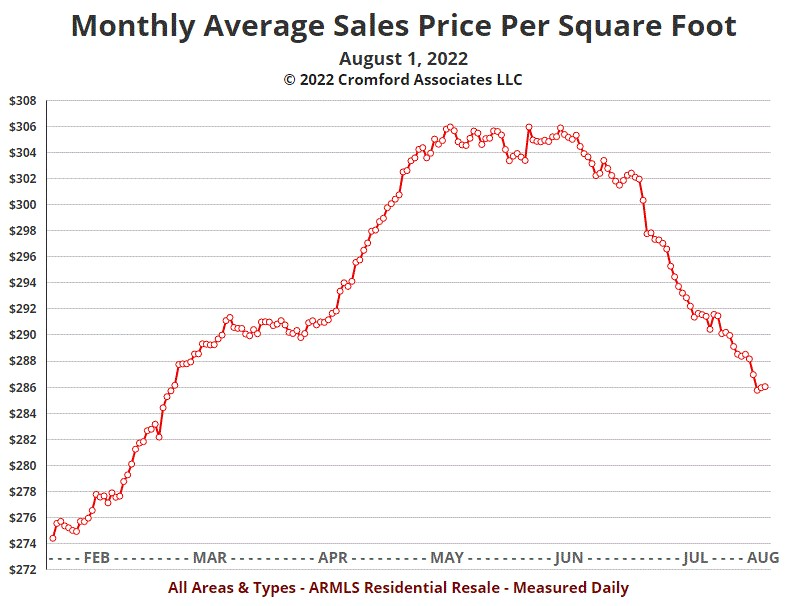
At $286 we are back down to the level we last saw in early March.
That is a 5% drop in July, much larger and faster than we were expecting. The average price dropped even more, from $592,275 to $546,888, a fall of about 8%.
Unfortunately this means those who purchased in May or June 2022 with very small down-payments could now be experiencing negative equity.
Jul 31 - The good news is that the supply of new listings is starting to fall. 2,589 listings were added to the ARMLS database during the last 7 days, which is up only 5.8% from a year ago. It is also well below the peak of 3,169 that we reached on June 25. While it is still considerably more than the current market needs, at least it is not on an increasing trend anymore.
The bad news is that demand not only remains very poor, it is getting weaker still.
We have only 7,887 listings under contract - down 28% from this time last year and the lowest total for the end of July since 2007. Since 2007 was our worst year ever, that is not a good place to be.
We are currently seeing a monthly sales rate of only 6,707 - down 25% from this time last year and the lowest for the end of July since 2014.
These figures are for all areas & types in the ARMLS database.
The average list price per sq. ft. of homes under contract is staying remarkably strong, hardly moving over the past 3 months. However sellers are achieving a far lower percentage of list price. In the past three months the closed price per square foot has dropped from 101.76% to 98.74%, down 302 basis points. This by far the fastest decline in achieved price percentage of list that we have ever seen. As a result, the monthly average sales price per square foot is down 5.3% in the last month. This is across all areas & types in the ARMLS database. The average sales price is down an astonishing 9.6% since the end of June, though the median sales price is down a more modest 4.8%. That is still a loss of $23,000 in one month.
Jul 29 - Of all the large cities in Central Arizona, Phoenix is showing the weakest pricing at the moment. Here is the weekly chart showing the average sales price for single-family homes in Phoenix: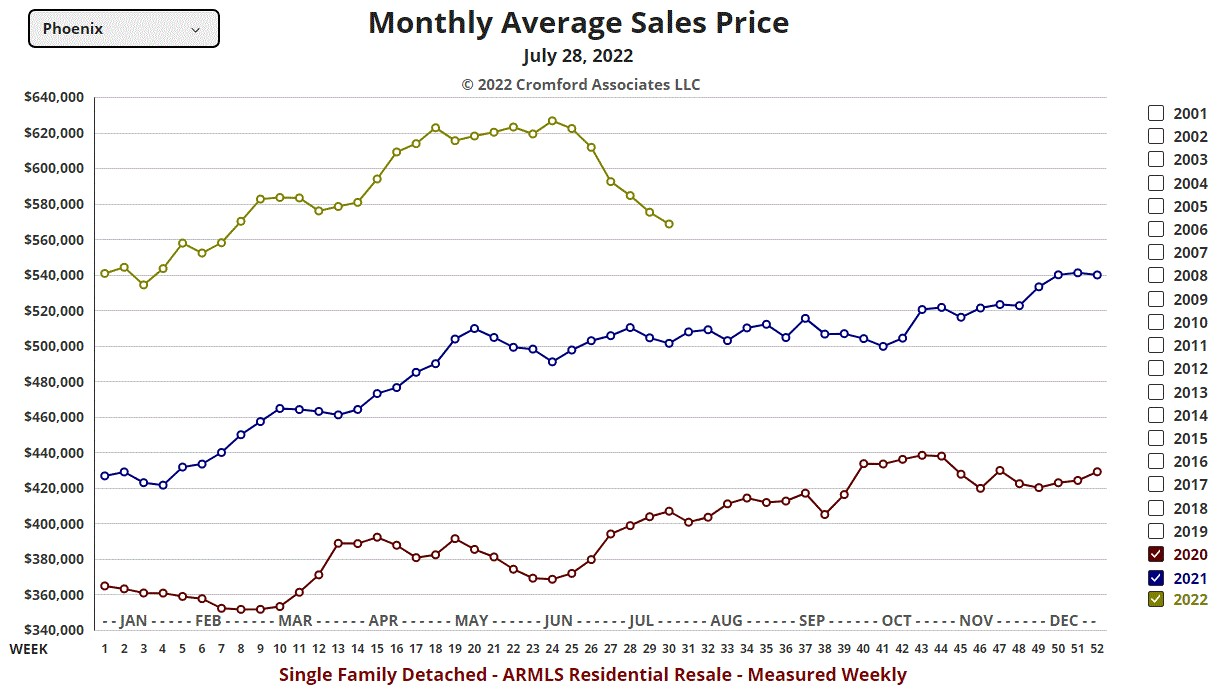
Having peaked at $627,135 in mid-June, the average has fallen by over 9% to $569,056. This takes us back to the levels we last saw in February.
It is not an anomaly of the average price, because the median price chart is similar:
The median sales price peaked at $498,000 at the beginning of June and has since fallen by 8% to $460,100.
The average price per square foot chart is a little less negative: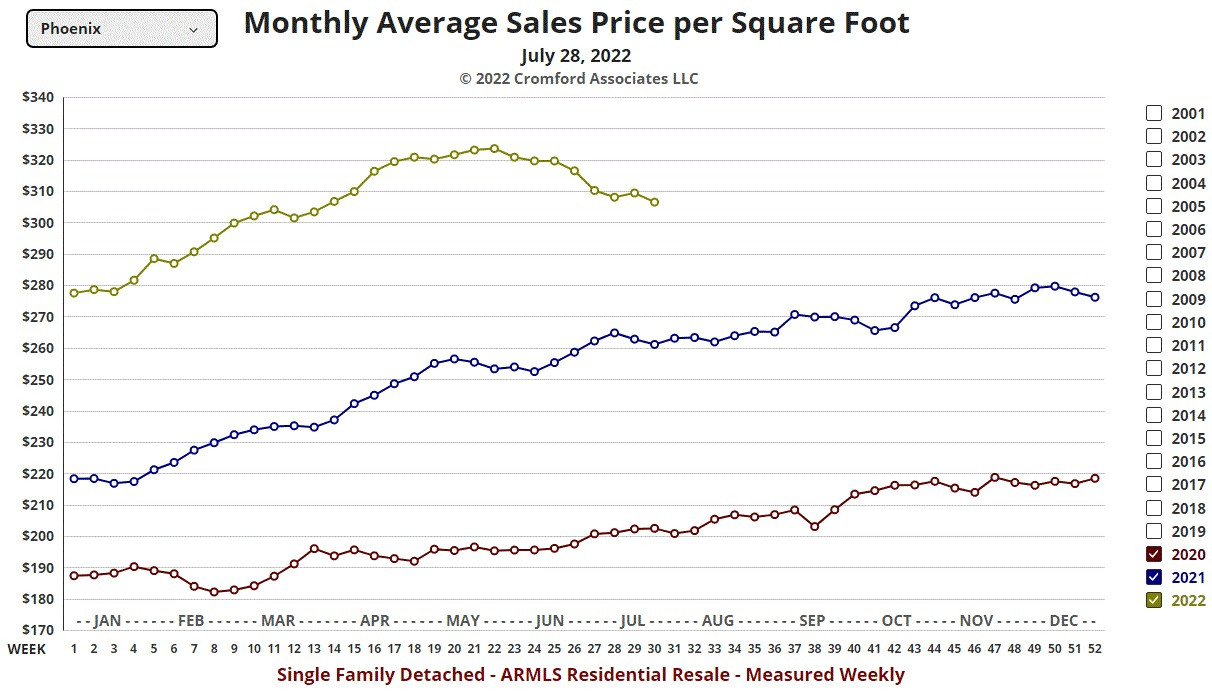
Here the peak of $323.83 was reached in late May and the $/SF has declined just over 5% since then.
It is not clear to me why Phoenix should take the lion's share of the price weakness, but as it represents about 25% of the entire market, it has a strong influence on the overall market numbers. Also looking rather weak are Chandler, Glendale, Mesa, Scottsdale, Sun City, Sun City West and Tempe.
Showing little to no sign of average $/SF declines are Arizona City, Avondale, Buckeye, Casa Grande, El Mirage, Fountain Hills, Maricopa, Sun Lakes and Surprise.
Jul 28 - Here is our latest table of Cromford® Market Index values for the single-family markets in the 17 largest cities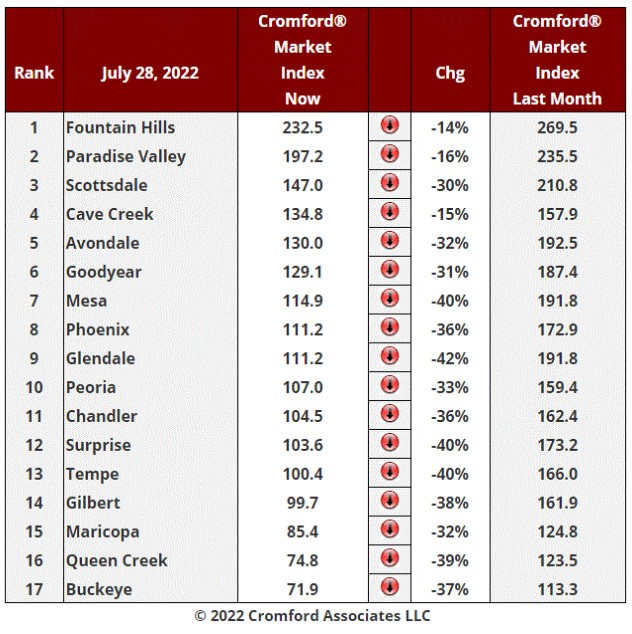
The average monthly change in CMI was -32%. This is an improvement on last week when the reading was -34%. It is still a very large deterioration in a very short time. New listings are still coming at us faster than last year, but not as fast as they were three weeks ago. Demand is still weak and showing only a few modest signs of stabilizing.
We now have 3 cities in a buyer's market - Buckeye, Queen Creek and Maricopa. Here buyers now hold a distinct negotiating advantage and have a total of 2,243 active single-family detached listings to choose from. This compares with 675 just three months ago. Because the majority of these areas cater largely to first-time buyers who are less experienced, it can take a few weeks for these buyers to realize how strong a hand of cards they hold.
Above them we have Gilbert, Tempe, Surprise, Chandler and Peoria in a balanced market where the buyers and sellers have no particular advantage. However astute sellers will realize that the situation is very fluid and slipping away from them. At the current rate of change, Gilbert will become a buyer's market by the end of the first week in August. Tempe is only a day or two behind Gilbert, while Surprise, Chandler and Peoria will probably become buyer's markets by mid-August.
Glendale, Phoenix and Mesa are seller's markets but within a couple of days will enter the balance zone between 90 and 110. At the current rate of change they will become buyer's market before the end of August. Goodyear and Avondale are 2 weeks behind these but unlikely to be still seller's market by the end of next month.
The 4 cities at the top of the table are in a different situation. The luxury market over $1.5 million is seeing far less of a surge in supply and although the market is deteriorating through weakening demand, the deterioration is much slower. However in Scottsdale, the less expensive end of the market is behaving similarly to the rest of the Greater Phoenix area.
Prices have looked wobbly for the last 2 months, but as buyers start to flex their muscles, we should be prepared for more serious consequences. While we cannot forecast accurately several months out, it would be reasonable based on current trends to expect significant declines in average prices, median prices and average $/SF by the end of 2022. Current trends can (and often do) change, so this is not baked in, just a reasonable base case.
We would not be surprised if the growth in supply started to slow down, but what is going to re-start demand? The most obvious answers are that either interest rates have to come down or home prices have to come down. Either or both of these can increase demand so we can get back to a balanced market again.
Jul 27 - We provide monthly counts of Arizona State building permits in the Cromford® Public section of this site. You can filter by County and local jurisdiction (city or town).
To summarize the current situation, single-family permits are now dropping in response to the weak demand but probably not as fast as they should. As of June there have been 17,788 single-family permits issued in Maricopa and Pinal counties year-to-date. This is down slightly from 18,803 last year, but it is otherwise the highest count since 2006. There were only 2,248 single-family permits issued in June, which is the lowest monthly total since May 2020.
Multi-family permits are a different story entirely. These are still in a full-bore gung ho status. There have been 8,640 multi-family permits issued year to date, easily the highest total we have ever seen. Last year there were 6,871 at the same point and that was considered a lot. There were 1,890 issued in June, making it the fourth busiest month ever.
Jul 26 - The latest S&P / Case-Shiller® Home Price Index® numbers were published on July 26.
The new report covers home sales during the period March to May 2022. So they do not reflect sales closed since June 1, 2022, nor the price weakness we have experienced over the past month.
Comparing with the previous month's series we see the following changes:
1. Miami +2.88%
2. Tampa +2.80%
3. Dallas +2.55%
4. Phoenix +2.48%
5. Charlotte +2.29%
6. Atlanta +2.21%
7. Las Vegas +2.12%
8. Boston +1.90%
9. Cleveland +1.88%
10. Chicago +1.83%
11. New York +1.65%
12. Detroit +1.60%
13. Minneapolis +1.34%
14. Washington +1.09%
15. Denver +1.08%
16. Los Angeles +1.05%
17. San Francisco +0.93%
18. Portland +0.91%
19. San Diego +0.55%
20. Seattle +0.55%
Phoenix has moved up from 7th to 4th place and remains well above the national average, which was 1.50%. The national average remains high, but down from 2.08% last month.
There is little obvious bad news in the above numbers, but we can be confident it is coming later in the year. The west coast has weakened significantly since last month.
Comparing year of year, we see the following changes:
1. Tampa +36.1%
2. Miami +34.0%
3. Dallas +30.8%
4. Phoenix +29.7%
5. Las Vegas +27.4%
6. Charlotte +26.4%
7. Atlanta +26.3%
8. San Diego +25.6%
9. Seattle +23.4%
10. Denver +22.2%
11. Los Angeles +22.1%
12. San Francisco +20.9%
13. Portland +17.4%
14. Boston +15.7%
15. Detroit +15.0%
16. New York +14.5%
17. Cleveland +14.3%
18. Chicago +12.9%
19. Washington +12.2%
20. Minneapolis +11.5%
The national average was +19.7%. As we predicted last month, Dallas has overtaken Phoenix and pushed it into 4th place.
Jul 25 - An update on the Opendoor listings on ARMLS as of July 24:
With 1,682 active listings without a contract, Opendoor represents 9.6% of available supply, which is far in excess of their 1.7% share of the listings under contract.
We estimate Opendoor's total inventory to be 2,286, which means there are another 461 homes that they own but are unlisted. They have about 7 months of inventory at the June sales rate, but the July sales rate looks rather slow in comparison with June.
We would anticipate that Opendoor's buying will slow down to avoid further build up in excess inventory. This would imply lower offer prices and fewer accepted offers, if we are correct. Demand measurements and pricing will weaken in these circumstances.
Jul 24 - Available supply has grown dramatically in most segments of the market since March 16, this year's low point. We had 4,367 active listings without a contract on March 16 and have 17,509 today. This is an increase of 301% across all areas & types. Within Greater Phoenix the growth has been 318% from 3,884 to 16,235.
By dwelling type we have seen supply grow at the following rates:
Single-family Detached - up 344%
Townhouse - up 370%
Apartment-style - up 288%
Gemini / Twin - up 130%
Loft-style - up 240%
Patio Home - up 257%
Mobile Home - up 65%
Modular / Manufactured - up 20%
These figures are for Greater Phoenix locations only. Out of area supply has grown 164%. It is very noticeable that mobile and manufactured homes have seen supply grow much more slowly than the rest of the market.
Largely due to a change in the mix of homes available, with low growth at the high end luxury market compared with the mid-ranges, the average advertised price of a home in Greater Phoenix is down from a peak of $1,010,002 on March 24 to just $731,744 today. The average available home size is also down from 2,430 to 2,172 sq. ft.
Jul 21 - Here is our latest table of Cromford® Market Index values for the single-family markets in the 17 largest cities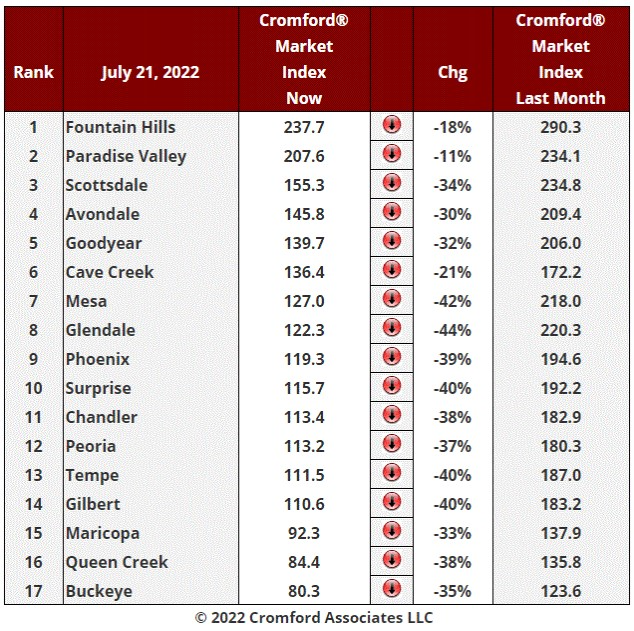
The average monthly change in CMI was -34%. This is the same as last week and the week before. The week before that it was -35%.
The deterioration in the market for sellers continues with almost as much speed as ever. There has been a slight reduction in the rate of arrival of new listings, but it is still much higher than last year at this time. Demand has not stopped falling and listings under contract are exceptionally low for the time of year. Even our best performing city, Paradise Valley, has slumped 11% over the last month, but it may yet overtake Fountain Hills and grab the top spot, since Fountain Hills fell 18%, the second best result. Cave Creek is third and fell "only" 21%, which looks good by comparison with the other 14 cities which range from -30% (Avondale) to -44% (Glendale).
Buckeye is now a buyer's market by a large margin and Queen Creek is almost as bad for sellers. Maricopa is not quite there yet but it will be a buyer's market in 2 or 3 days. Gilbert, Tempe, Peoria, Chandler and Surprise are all going to be balanced markets within a few days and on their current trajectory they could be buyer's market by mid August. The largest market by far, Phoenix, looks like it will be balanced before the end of July and a buyer's market before the beginning of September. Glendale and Mesa are just a week or so behind.
The high end market is still holding out much better than the mid-range.
Only 3 cities are now over 150. A month ago we had 14. The market has changed dramatically for the worse over the past 4 or 5 weeks.
Jul 19 - An updated chart appears below showing the listing counts for OfferPad in the ARMLS database.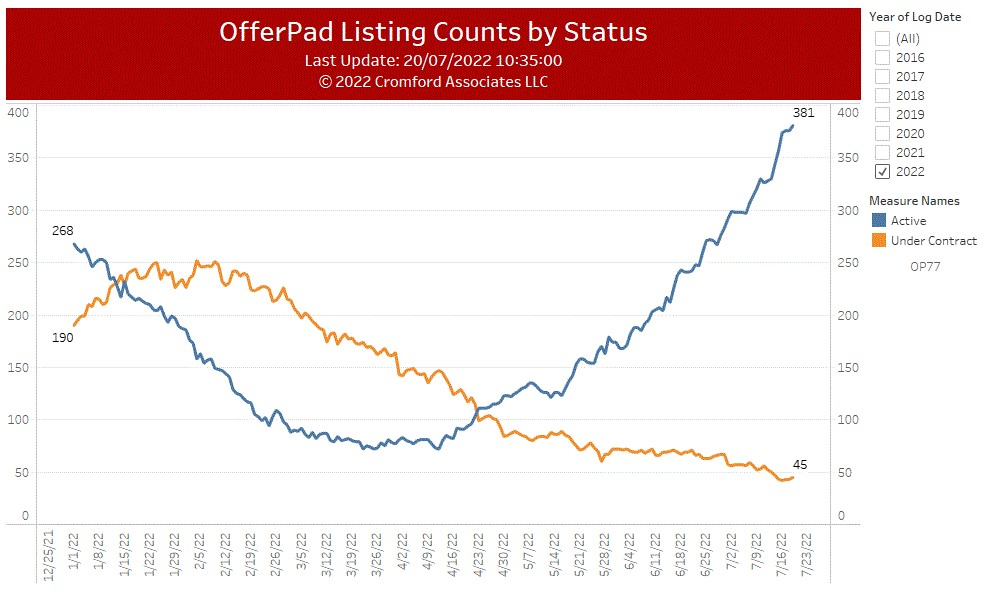
The dramatic change in market conditions has taken their active count from a low of 72 on April 12 to 381 on July 19. This latter number has increased 58% in the last month.
We estimate that OfferPad has 453 homes in inventory, which implies there are only 27 unlisted properties. 45 are under contract which gives OfferPad a contract ratio of less than 12. On April 12, their contract ratio was 204.
Based on their monthly sales rate for June, they have about 6.7 months of homes to sell, even if they stopped buying today.
The rest of us should be grateful that the iBuyers have soaked up so many homes over the last 3 months. Without their activities the market statistics would show a much larger drop in demand than reported. It has not made a lot of different to supply since the homes they have listed would probably still be listed by their former owners if they had not sold them to an iBuyer,
It seems that the iBuyers will need to focus mostly on iSelling during the second half of 2022.
Jul 18 - The long-term rental supply is still growing very quickly - we have 2,916 active listings, up 18% from 2,463 last month and up 113% from 1,367 this time last year.
Most of the supply on ARMLS is single-family detached, with 2,088 listings. This has grown 27% from 1,641 last month and 165% from 795 this time last year. All those people building new homes to rent should take heed that they will have plenty of competition from other landlords to attract a limited pool of prospective tenants.
The average rental asking price on ARMLS is down to $1.57 per square foot per month. This has dropped from $1.63 last month and $1.94 this time last year.
Jul 17 - The listing success rate is one of the simplest yet most revealing of measurement tools for the housing market. Here is the most recent weekly chart for all areas & types.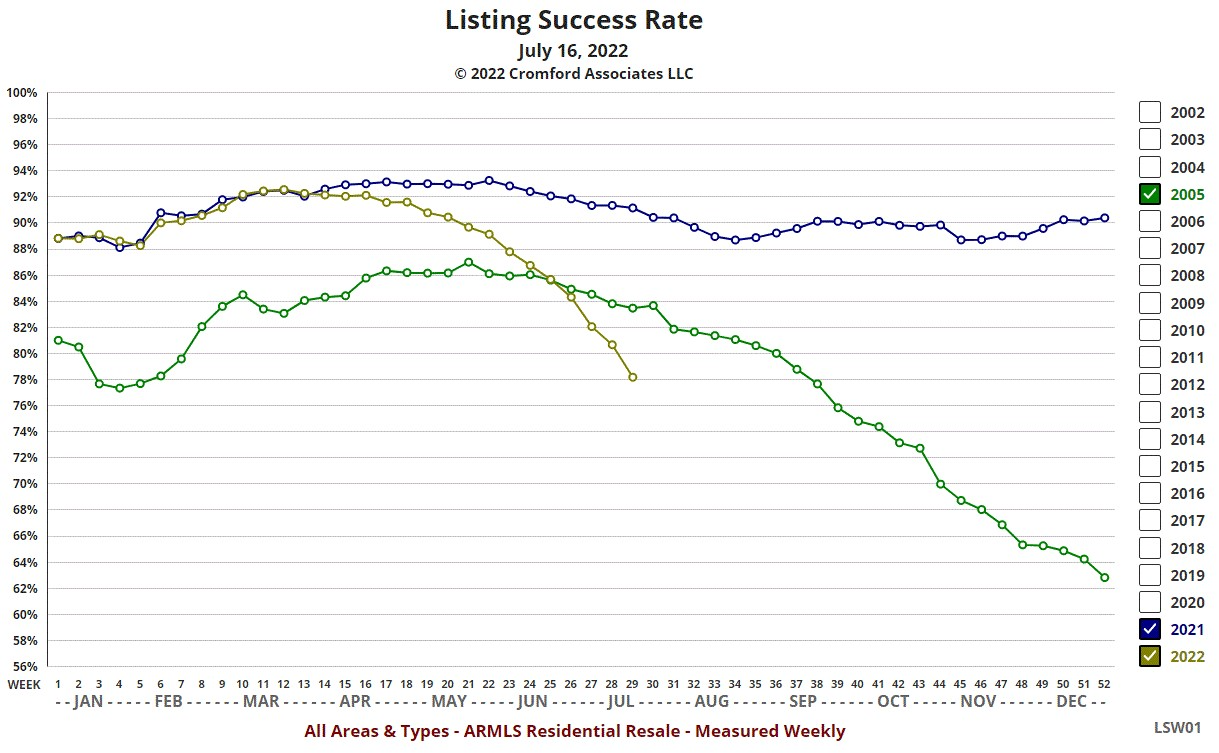
We can see how 2022 was tracking very close to 2021 until it started losing height in May. The success rate has deteriorated quickly in June and July and now stands at 78.2%. The trend is downward with strong momentum.
We included 2005 for comparison and although the success rate deteriorated during during the second half of the that year, it took longer to get back to the long-term average of about 67%.
Based on the current rate of decline we are only 3 or 4 weeks away from hitting that 67% milestone. At that point roughly one in three listings will fail to sell.
Jul 16 - The average list price per square foot for active listings in Greater Phoenix (excluding UCB and CCBS) is $339.56 today
At the same time last year we measured $340.15
This year-over-year decline in the average asking price is mostly caused by the huge growth in the number of mid-range listings. High-end listings have grown by a far smaller percentage. The change in the mix tends to pull the average $/SF lower.
If we confine our analysis to homes priced between $500,000 and $1 million, then the asking price has increased from $266.26 to $286.41 over the last 12 months. The average for this price range peaked $293.08 seven weeks ago and is now trending lower.
But before we draw any big conclusions from that, it also peaked 6 weeks ago in 2021 and trended lower for 3 months before starting to rise again.
Jul 14 - Here is our latest table of Cromford® Market Index values for the single-family markets in the 17 largest cities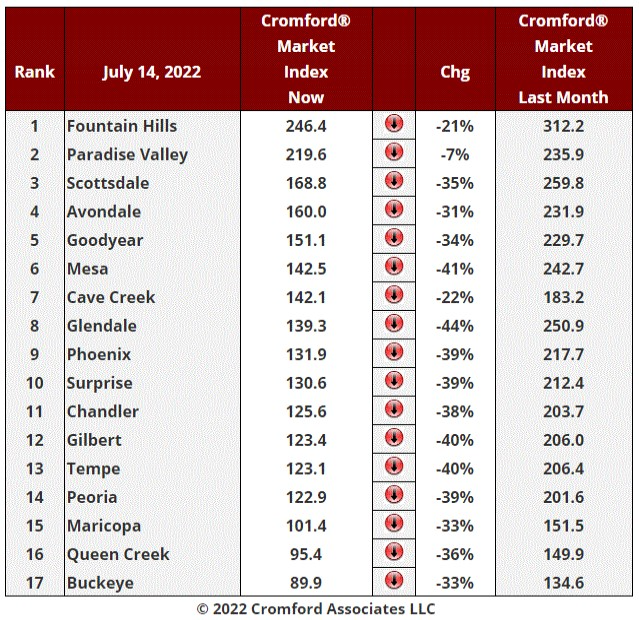
The average monthly change in CMI was -34%. This is the same as last week. The rate of decline in the CMI readings over the past two months is easily the fastest we have ever witnessed.
The negative trend remains extremely powerful. Supply is still growing at roughly 1,000 listings a week while demand is still weakening despite some (possibly temporary) relief in the mortgage rates. We now have 1 city (Buckeye) which is a buyer's market and 2 cities (Maricopa and Queen Creek) that are in the balanced zone between 90 and 110. It is just a matter of days before Maricopa and Queen Creek become buyer's markets and their time in the balanced zone will have been very short indeed. Peoria, Tempe, Gilbert, Chandler, Surprise and Phoenix are all just a week or two away from a balanced market as they all dropped close to 40% in the last month. Based on current trends, these 6 cities will probably be buyer's markets before the end of August.
Things are different in Paradise Valley where there has been very little increase in supply and the 7% fall in its CMI is entirely due to a drop in demand. Fountain Hills and Cave Creek are also seeing declines in their CMI, but at roughly half the rate of the average city in the valley.
Only 5 cities are now over 150. A month ago we had 15.
Buyers are much more aware of the dramatic change in the market than are sellers. New sellers will need to take time to understand just how different market conditions are today compared with 3 months ago. They should not expect multiple bids. They should plan to market their property, not just sell it.
With the Federal Reserve considering a 1% rise in the federal funds rate in their July meeting, demand could drop even lower next month if mortgage rates move sharply higher again.
Jul 13 - Rental supply is growing in the ARMLS database, with single-family detached rentals growing fastest. On July 12, there were 2,012 single-family detached homes available for long-term rent with an average price per square foot of $1.57 per month. One year ago we saw 820 homes at $1.90 per square foot per month.
Apartments on offer for long-term rent number 443 at an average rent of $2.08 per square foot per month. Last year at this time we had 332 at an average of $2.13.
There are 33% more apartments and 145% more single-family detached homes on offer to tenants compared with 12 months ago.
The average rent asked has dropped 2% for apartments but 17% for single-family homes. The latter does not mean average rents have fallen 17%. It reflects a mix where far more lower priced rentals are being listed than in 2021.
However it is pretty clear that the era of rapidly rising rents is coming to an end.
Jul 12 - Rental supply is growing in the ARMLS database, with single-family detached rentals growing fastest. On July 12, there were 2,012 single-family detached homes available for long-term rent with an average price per square foot of $1.57 per month. One year ago we saw 820 homes at $1.90 per square foot per month.
Apartments on offer for long-term rent number 443 at an average rent of $2.08 per square foot per month. Last year at this time we had 332 at an average of $2.13.
There are 33% more apartments and 145% more single-family detached homes on offer to tenants compared with 12 months ago.
The average rent asked has dropped 2% for apartments but 17% for single-family homes. The latter does not mean average rents have fallen 17%. It reflects a mix where far more lower priced rentals are being listed than in 2021.
However it is pretty clear that the era of rapidly rising rents is coming to an end.
Jul 11 - The average $/SF for closed listing is looking more than a little weak over the past few weeks: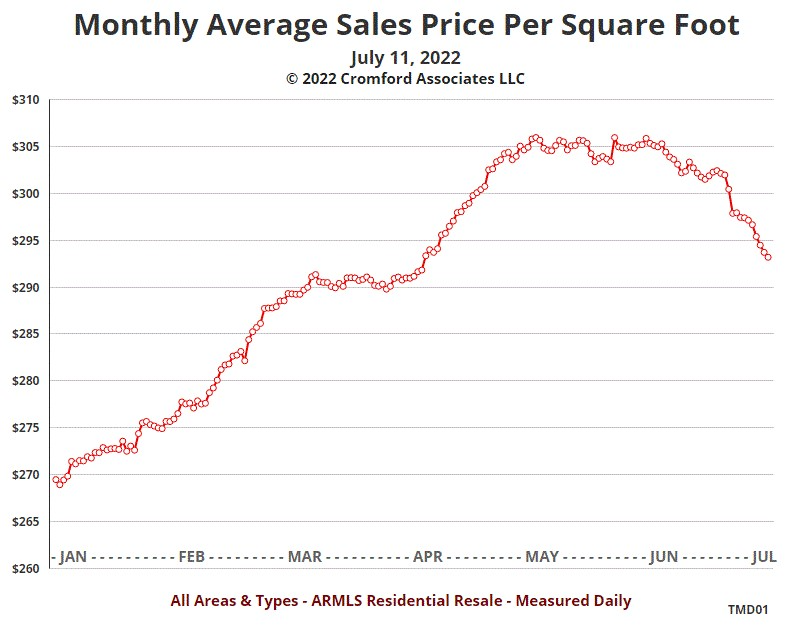
The peak was May 13 at $306 but we also hit $305.99 on June 2. It was not until June 15 that a declining trend started and a drop of 4% from the peak has now taken place.
Jul 10 - We have added a new chart - Average Price per Square Foot for Active Listings by Major City
This allows you to compare prices over the last 3 to 4 months for each of the 17 largest cities.
We can see obvious weakness in asking prices for:
Buckeye
Cave Creek
Fountain Hills
Phoenix
Scottsdale
The remaining 12 cities have mostly been moving sideways. However Phoenix and Scottsdale account for about one third of the total market, so if these are trending down, the whole market measures will tend to follow suit.
Jul 9 - Examining how the contract ratio has changed for the 29 largest cities, we get the table bow, which ranks the cities from least to most affected by the downturn in the market: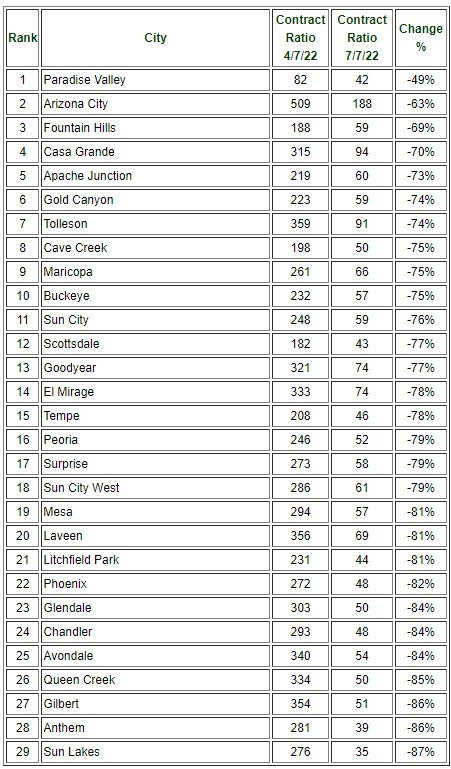
All 29 cities have seen their single-family markets cool down, but Paradise Valley has cooled much less than the others.
Casa Grande and Arizona City have also done better than average, perhaps supported by the new industry that has been established in their local area.
The Southeast Valley has fared particularly poorly, as has Phoenix, Glendale and Anthem.
We normally classify readings under 60 as corresponding to a balanced market. By this definition, 19 of the 29 cities are already in a balanced market while Sun Lakes and Anthem are most in danger of slipping into a buyer's market.
Jul 8 - Here is our latest table of Cromford® Market Index values for the single-family markets in the 17 largest cities
If you are looking for some good news, I have a tiny morsel for you. The average monthly change in CMI was -34%. This is smaller than the -35% we saw for each of the past three weeks. However the difference is really small and the negative trend is still very powerful. We now have 2 cities (Buckeye and Queen Creek) that are in the balanced zone between 90 and 110 and a third (Maricopa) that is only a seller's market by one tenth of a point. We can be confident that Maricopa and Queen Creek will be in a balanced zone next week, but on current trends, Buckeye will be the first city to become a buyer's market during the third week of July. Queen Creek and Maricopa look likely to follow before the end of July.
Paradise Valley is seeing a very stable supply and its CMI is down only 3% for the month. Fountain Hills and Cave Creek are next best with falls of 25% and 26% in their CMI
Much worse are all the other 14 cities with CMI dropping by 32% or more. Glendale is worst this week with a 43% fall.
Because the CMI is based on a formula that uses rolling averages and smoothing techniques, at this time of unprecedented rapid change it understates quite how far the market has deteriorated for sellers. With so many new sellers and so few buyers, prices are looking more wobbly by the day and almost all the price readings look very ready to drop during July.
Almost all the monthly median sales prices are below their recent peak. For example on July 7:
Avondale is down from $460,000 to $450,000
Buckeye is down from $451,040 to $445,500
Chandler is down from $630,000 to $577,450
Gilbert is down from $635,000 to $623,950
Goodyear is down from $554,700 to $520,800
Maricopa is down from $415,000 to $410,000
Mesa is down from $520,000 to $500,000
Peoria is down from $570,000 to $550,000
Phoenix is down from $500,000 to $480,000
Queen Creek is down from $515,000 to $510,000
Scottsdale is down from $1,115,000 to $1,100,000
Surprise is down from $494,495 to $490,000
Tempe is down from $585,000 to $555,000
Only Glendale is unchanged at $475,000 but this will probably not last much longer.
We omit Cave Creek, Fountain Hills and Paradise Valley because their monthly medians are far too volatile to be useful, as a result of their very small transaction volumes and wide ranges in home prices.
Unless trends change sharply from their current trajectory, we are likely to see further weakness in median sales prices over the next several months. We are definitely NOT able to forecast 5 months into the future. However it would not be at all surprising if prices in December 2022 were in the same ball-park as those we saw in December 2021. This is just one of many plausible outcomes that would have looked nearly impossible to imagine as recently as March when almost every seller had multiple buyers to chose from.
July 7 - The affidavits from Maricopa County Recorded that were filed in June have now been counted and collated and we have the following preliminary statistics:
There were 9,478 closed transactions in June, down 22.4% from June 2021. New homes were down 7.7% to 1,533 while re-sales were down 24.8% to 7,945.
The median sales price was $486,824. This is down 0.65% from last month but up 21.7% from June 2021.
New home median was $500,454, almost unchanged from last month (down $36) but up 22.8% from June 2021
The re-sale median was $484,000, down 0.41% from last month but up 21% from June 2021.
These are for single-family detached and condo / townhouse properties.
In summary, prices have stopped rising but are still much higher than last year while sales volumes are dramatically lower than last year.
The trends in re-sales tend to show more volatile movement than in new homes.
July 6 - As we look at different price ranges, we can see that all of them have cooled significantly in the three months since April. The least affected is the range over $3 million, where the contract ratio has declined 43% from 67 to 38. In expensive locations like Paradise Valley and Carefree, the supply of active listings remains low by long-term standards and the market is relatively resilient.
Below $3 million contract ratios have declined by at least 74%, a colossal drop in just 3 months and easily the fastest and most significant cooling that has been seen in the Greater Phoenix housing market since we started studying it in 2001.
Hardest hit is the single-family detached price range between $500,000 and $600,000 where the contract ratio has dropped 84% from 296 to below 49. This price range is no longer a seller's market and there are plenty of listings for each buyer to choose from. Bidding wars are almost over. There were 2,434 active listings as of July 1, with 358 of these in UCB or CCBS status leaving 2,076 available for buyers. Is this a lot? It certainly is. It is up 236% from April 1 and up 341% from July 1, 2021. It is also the highest total we have recorded for this price range since June 2008. We must consider it in context. Last month 1,079 homes sold in the price range, so in this light, 2,076 does not seem so high. But most of those sales were contracted well before the latest round of interest rate rises, so we would expect sales rates to drop in July, while the active listing count looks like it is headed considerably higher.
If you have a home in the price range $500,000 to $600,000, our advice is to accept that you have a lot of competition from other sellers and the market trend is not moving in your favor. Be realistic in your expectations and you will probably be fine. But price too high and you could be left chasing a falling market with price cuts that may come too late.
July 4 - Now would be a good time to take stock of where prices have been going. The chart below shows:
1. In blue - the average list price per square foot of listings in active status
2. In green - the average list price per square foot of listings in pending status or active with UCB or CCBS status
3. In brown - the average list price per square foot for one month's worth of closed listings
4. In red - the average sale price per square foot for one month's worth of closed listings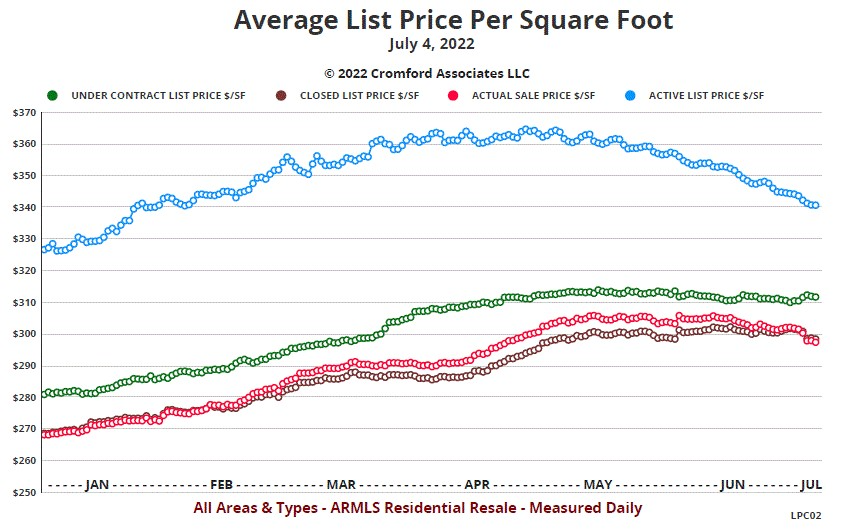
This chart tells us quite a few things:
Asking prices for homes for-sale have been on a downward trend since peaking just under $365 per square foot on April 27, three days after our first red-flag warning was issued.
The average list price per square foot for active listings is down 6.6% over the last 68 days
The average list price per square foot for listings under contract has failed to break above $315 and has moved mostly sideways since peaking at $314.06 per square foot on May 14
The average list price per square foot for listings under contract is down 0.7% over the last 51 days
The average list price per square foot for closed listings has failed to break above $303 and has moved mostly sideways since peaking at $302.38 per square foot on June 14
The average list price per square foot for closed listings is down 1.3% over the last 20 days
The average sale price per square foot for closed listings peaked on May 13 at $305.99 and has fallen 2.8% since then (52 days)
The blue line is being driven down by 3 main factors
more listings are piling up in the ranges from $400,000 to $600,000 than other price ranges. This change in the mix brings the average price per square foot down.
new listings are being added at less ambitious prices as sellers start to get more realistic in their expectations
large numbers of existing listings have had their asking prices cut as sellers get even more realistic in their expectations
The average price per square foot for active listings remains well above its level in January when the market was still getting hotter. The trend is clearly down however.
The green line needs to fall if the brown line is going to decline significantly. Both are currently moving sideways, but with a bias towards the downside.
The red line has moved from well above the brown line to just below the brown line. This is what we commented on yesterday. The lowering of closed sales prices has been driven down by sellers agreeing to take a lower percentage of their asking price than they were accepting 30 days ago.
Overall, we see a market that is past its top and looking wobbly. To avoid a more serious downward trend in prices, we would need to see supply stop growing and demand stop shrinking. We will be examining the numbers every day for any sign of either of these events occurring. If both happen, then we would expect stabilization. If neither happens then we would expect all price measurements to move lower during the second half of 2022.
July 3 - One of the many indications of a cooling market is the average closed price as a percentage of the final list price. We measure this for closed listings with a close date in the monthly period that just ended.
On July 1 this statistic dropped below 100% for the first time since February 11. The peak reading was 101.85%, which was attained on April 27. It remained over 101% right up until June 13, but has been falling very quickly since then.
After dropping through 100% 2 days ago it has already fallen to 99.73% and looks set on a trend back towards the long term average of 97.35%.
The lowest reading ever was 93.82%, which occurred on February 5, 2009.
This statistic is a bit like taking the temperature of the market. Around 97% to 98% is normal. When it is over 100% the market has a fever. When it is below 95% it is suffering from hypothermia.
July 1 - The Contract Ratio for all areas & types in the ARMLS database has now dropped below 60.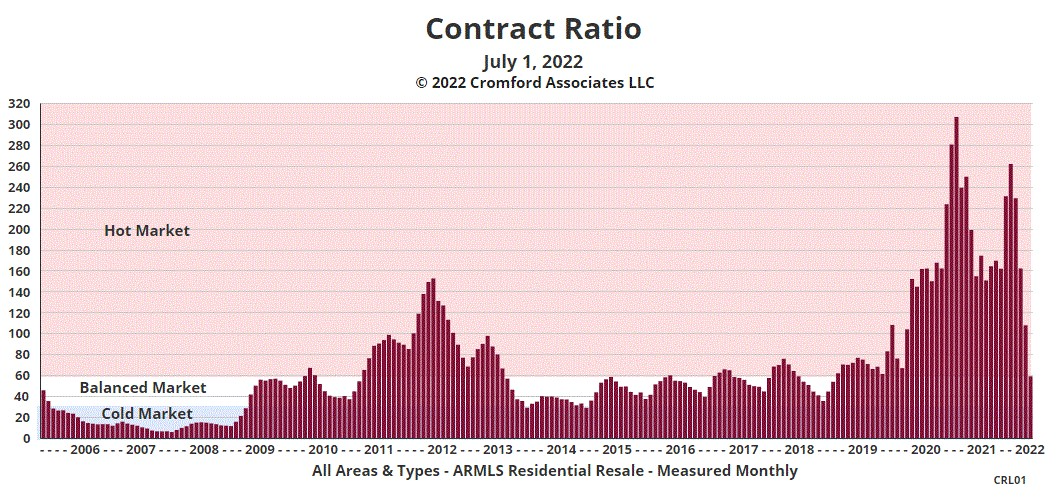
This is in the "Balanced Zone" between 30 and 60, confirming just how far and how fast the market has cooled in the last 3 months.
Four months ago we had the third highest reading (262.6) we had ever recorded. In April this had moved down to 230.1, still very hot.
The collapse between April and June is unprecedented - faster and more violent than we have ever witnessed. This is due to a very rapid decline in demand coupled with an explosive rise in supply.
At 59.8, the contract ratio is the lowest we have seen since March 2019. The trend indicates that it has further to fall.
The contract ratio is a simple and immediate measure, with no averaging or smoothing effect. It is therefore very responsive to violent changes in the market. In contrast the Cromford® Market Index is based on averages over the prior 30 days and is smoothed to avoid reacting to insignificant variations from day to day. It normally gives a more reliable picture of the market than the contract ratio. However in times of dramatic change, it can move a little slower because of the averaging and smoothing. I would take signals from the contract ratio to be more up-to-date by an average of 2 weeks compared to the CMI. At the moment the CMI is clearly telling us that the market is cooling rapidly, but it probably understates by a week or two just how far it has already cooled as of July 1.
The contract ratio is telling us that we are already in a balanced market. If it drops below 30 then it will indicate a cold market with a significant surplus of sellers over buyers. We have not experienced a market like that since April 2009.
Jun 30 - Here is our latest table of Cromford® Market Index values for the single-family markets in the 17 largest cities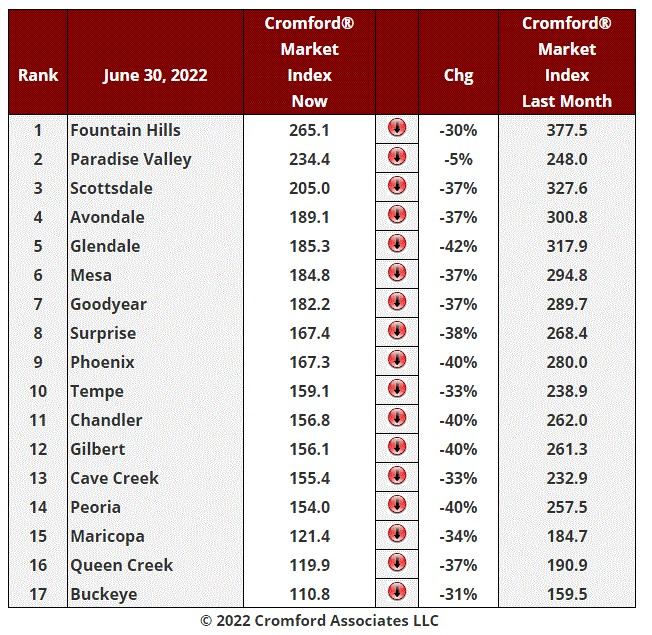
This is the third week in a row where the average monthly change in CMI was -35%. There is not much difference between 16 of the 17 cities, but Paradise Valley stands out as an exception. It has only lost 5% over the past month and has even seen no fall at all over the past 10 days. Among the smaller cities, Arizona City stands out - its CMI has been rising for the last 2 weeks with demand in this relatively inexpensive location staying unusually strong.
These 2 exceptions aside, the plunging demand and rising supply is having a dramatic effect on market balance. Buckeye will be a balanced market during the first 2 weeks of July with that balance looking like it will swing more towards buyers with every day that passes. Queen Creek and Maricopa are about 1 week behind Buckeye. We then have Cave Creek, Chandler, Gilbert, Peoria, Phoenix, Surprise and Tempe all in a similar condition. Their markets are cooling rapidly and look likely to move into the balance zoned within a matter of weeks rather than months.
Unless the current trends change, we could be in a buyer's market across much of Central Arizona by the beginning of September.
One brighter sign is that the number of new listings over the past 7 days is down from the extreme high of the week before. At some point the seller stampede may run out of new sellers. This is not happening yet, but at least the rate at which sellers are joining the stampede is slowing.
Jun 29 - Opendoor has continued to buy a high volume of homes through the downturn and sellers should probably be grateful that it has soaked up so much of the growing supply. Here is a chart showing the daily counts of Opendoor listings on ARMLS. Only active (without a contract) and Under Contract (Pending, UCB, CCBS) are shown.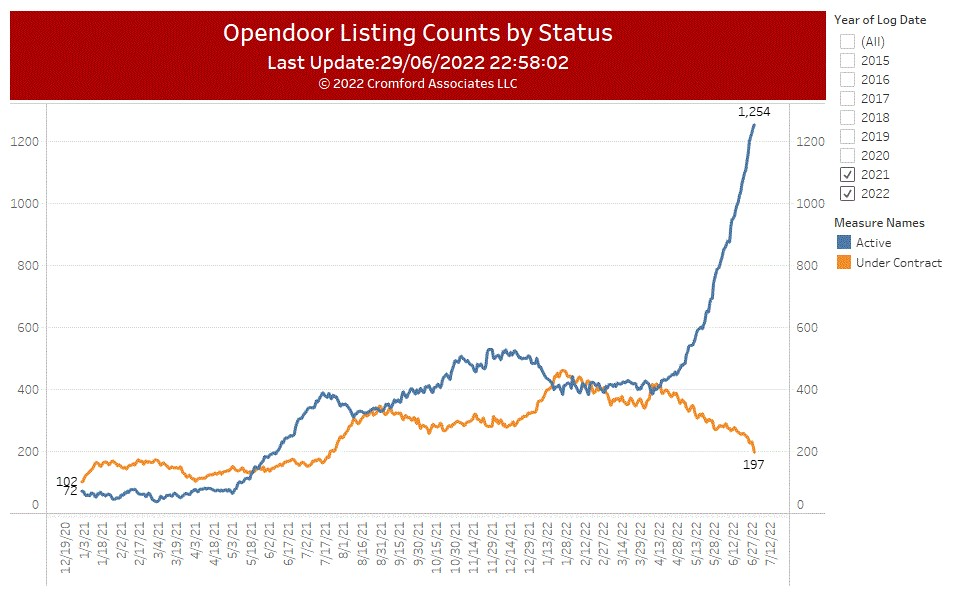
Opendoor has built up an inventory of 1,254 active listings, by far its largest total since it started operation in 2014. The previous record active listing total was 638 in January 2019.
The weakening demand has affected Opendoor as much as anyone with only 197 listings under contract as of today. This is the lowest total since last July.
The contract ratio is 100 * 197 / 1254 = 15.7 This is a cold reading and indicates that Opendoor's supply is far in excess of its demand. While it has done other sellers a favor by continuing to buy homes, it has amassed a large inventory of homes that are going to take a long time to sell. The contract ratio was a hot 120 as recently as the end of January and 109 in early April. The second half of April was when troubled started.
Opendoor's current active listing count represents over 5 months of supply at the current monthly sales rate. It also represents about 9% of all active listings on ARMLS while their homes under contract represent less than 3% of ARMLS.
Of course Opendoor's total inventory is higher than the active listings on ARMLS, because many homes they have purchased are still being prepared for sale. Based on deeds recorded, we estimate there are a total of 2,034 homes in inventory of which 1,254 are active and 197 under contract. This leaves 583 in their "shadow inventory" being prepared for sale. This means they have a total of about 8 to 9 months of supply at their current monthly sales rate.
Jun 28 - The latest S&P / Case-Shiller® Home Price Index® numbers were published on June 28.
The new report covers home sales during the period February to April 2022. So they do not reflect sales closed since May 1, 2022, nor the market slowdown we have experienced over the past 3 months.
Comparing with the previous month's series we see the following changes:
1. Miami +3.40%
2. Dallas +3.16%
3. Tampa +3.03%
4. Boston +2.83%
5. Charlotte +2.69%
6. Denver +2.54%
7. Phoenix +2.46%
8. Las Vegas +2.33%
9. Atlanta +2.32%
10. Seattle +2.30%
11. San Diego +2.28%
12. Detroit +2.24%
13. Minneapolis +2.20%
14. Portland +2.20%
15. San Francisco +2.18%
16. Los Angeles +2.01%
17. New York +1.99%
18. Chicago +1.93%
19. Washington +1.91%
20. Cleveland +1.36%
Phoenix has moved up from 11th to 7th place and remains above the national average, which was 2.08%. The national average remains high, but down from 2.55% last month.
Comparing year of year, we see the following changes:
1. Tampa +35.8%
2. Miami +33.3%
3. Phoenix +31.3%
4. Dallas +31.0%
5. San Diego +28.5%
6. Las Vegas +28.4%
7. Charlotte +26.6%
8. Atlanta +26.4%
9. Seattle +26.1%
10. Denver +23.6%
11. Los Angeles +23.4%
12. San Francisco +22.9%
13. Portland +19.1%
14. Detroit +15.3%
15. Boston +15.1%
16. Cleveland +14.5%
17. New York +14.3%
18. Chicago +13.0%
19. Washington +12.7%
20. Minneapolis +12.3%
The national average was 20.4%. Phoenix has slipped below Miami and looks likely to be overtaken by Dallas next month.
All these numbers are likely to look very different 12 months from now.
Jun 26 - The last 2 months have been dismal for the Greater Phoenix housing market, with demand fading sharply and supply growing at one of the fastest paces we have ever witnessed. Either trend would have been negative but with both coming together we have had a very chilly wind blowing through the market.
For many weeks, we have been looking for some convincing sign of the relaxation of one or both of these trends. We have not found any. Instead, over the last week, the situation has turned significantly worse, at least from a seller's viewpoint. And it is worse from both a demand and a supply perspective.
There were just 1,558 accepted contracts during last week, down from 1,898 the week before and 2,274 during the same week in 2021. This makes it by far the least productive week in more than 2 years, if we exclude the week between Christmas and New Year, when most people are not signing contracts. It is even lower than during the first covid-19 wave in April 2020. That is worth thinking about for a moment. We now have fewer people signing a purchase contract than during a period when almost everyone was advised to stay at home for the sake of their health. This sort of collapse in demand is very unusual and with another round of interest rate rises likely within a few short weeks, it is difficult to imagine it improving in the near term. We have a full-on buyer's strike developing.
At the same time, more homes are being newly listed for sale than at any time since 2011. The active listing count (without a contract) rose 12% last week. We saw a 10% increase the week before, so the rate of increase in supply is accelerating, not slowing. We have 1,464 more homes for buyers to chose from than a week ago and 133% more homes available than there were 12 months ago. Over 200 a day is an excessive growth rate. We are witnessing a full-on seller's stampede.
We are not seeing forced selling, like we experienced during the foreclosure wave of 2007 to 2011. This is people electing to sell because they fear a fall in home prices. That fear is likely to be self-fulfilling. When so many attempt to make it to the exit door ahead of everyone else, people get hurt. The stampede for the exit is now large enough that it is certain to do significant damage to home values. We do not pretend to know how much prices will fall in numeric or percentage terms, but the latest data suggests that it is already impossible for home prices to rise under the current market conditions. As people get more anxious to dispose of their housing assets, price cuts are growing in number and size. The very top and bottom of the market are least affected, but the mid-range, where the vast majority of transactions occur, is experiencing a big freeze.
When a buyer's strike and a seller's stampede occur at the same time, the market stalls in mid-flight. A price correction becomes inevitable. The Federal Reserve has stated that they want to see a "reset in the housing market", and it looks increasingly likely that their wish will come true.
Jun 25 - Much of the wilder recent activity has taken place in the residential resale market, but there are interesting thinks happening in the rental section of the ARMLS database too.
There are 2,722 active rental listings. This is up 15% on last month and up 97% on the same date last year. If you thought that rentals were scarce, you are out-of-date. We have not had so many for prospective tenants to choose from since May 2020.
Even better news for those tenants is that the average rent being asked is coming down. The average rent per sq. ft. per month for active rental listings is $1.66 right now, down from $1.70 last month and $1.94 last year.
Of course, what is good news for tenants is bad news for landlords. They are finding it harder to fill their properties and harder to raise the rent over last year.
When times are good, landlords rarely bother to list their homes on ARMLS. Why bother to offer even a meager commission if you can find a tenant easily and quickly. This is why the ARMLS listings tend to lean towards the more expensive or unusual properties. When times are less than good, a lot more landlords are tempted to list their available properties on the MLS, even if the commission offered is still pretty tiny.
As a sign that times are changing from good to not-so-good, My Community Homes just listed 275 rentals all at once last week. I say all at once, but their hard-working agent took 3 days to get all the information entered. My Community Homes is one of the new institutional buyers of homes to rent, having purchased their first as recently as last December and they have amassed a collection of 467 homes by mid June, buying from many different sources including the iBuyers.
I am slightly surprised to see that almost 60% of their properties are looking for tenants. That is probably more vacancy than they would like. Homes without tenants lose money unless those homes are appreciating in value fast. These homes are not appreciating in value under today's market conditions, so they need tenants quickly.
Institutional investors who purchased a hundreds of homes from lenders in 2011 and 2012 have made huge capital gains thanks to home price appreciation after buying close the bottom of the market cycle. But recent new entrants may find they have bought homes close to the top of a market cycle. This is not so rewarding an experience.
Jun 24 - The Greater Phoenix housing market has changed dramatically over the past 2 months, at a pace that can make it hard to take in. You need a tool that can show how fast the market is switching from hot to cold and I suggest that tool is the Contract Ratio. You can find the definition in our definitions section.
Once you are fully comfortable with how the contract ratio works then the Tableau Chart can be useful for see what the contract ratio is doing in any chosen segment of the market.
A simpler chart with fewer controls is the weekly chart by city. Here is an example of that chart with Phoenix selected: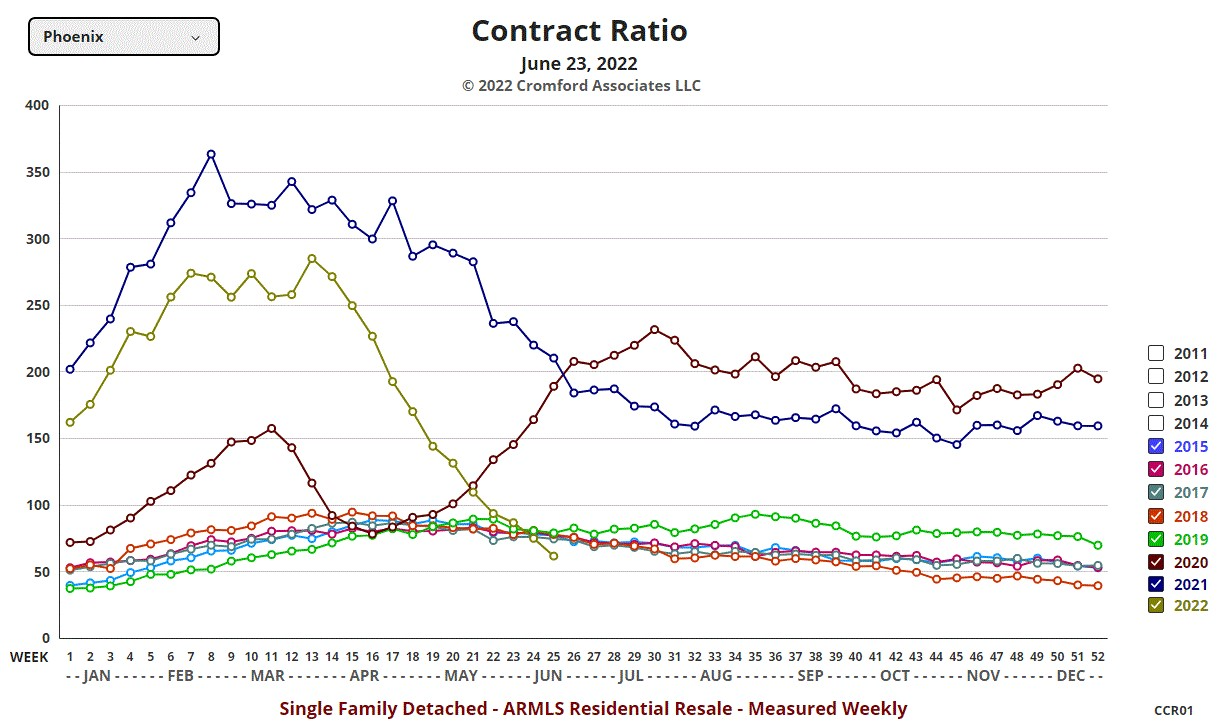
What we learn from this chart is that the contract ratio in the city of Phoenix (single-family detached) was a very strong 250 as recently as mid-April. In just 2 months, it has collapsed so far that it now stands at a lowly 62. This is already the weakest reading since 2014 for week 25. What makes it even more alarming is that the contract ratio has not yet stopped moving lower. It shows every sign of diving much lower still. Next week we expect it to go below the 2014 reading of 56.
There may be many people who have yet to fully comprehend or accept how hard the brakes have been slammed on our market. My tip - do not underestimate the impact of these changes. Brace yourself for a bumpy ride in the months ahead.
Jun 23 - Here is our latest table of Cromford® Market Index values for the single-family markets in the 17 largest cities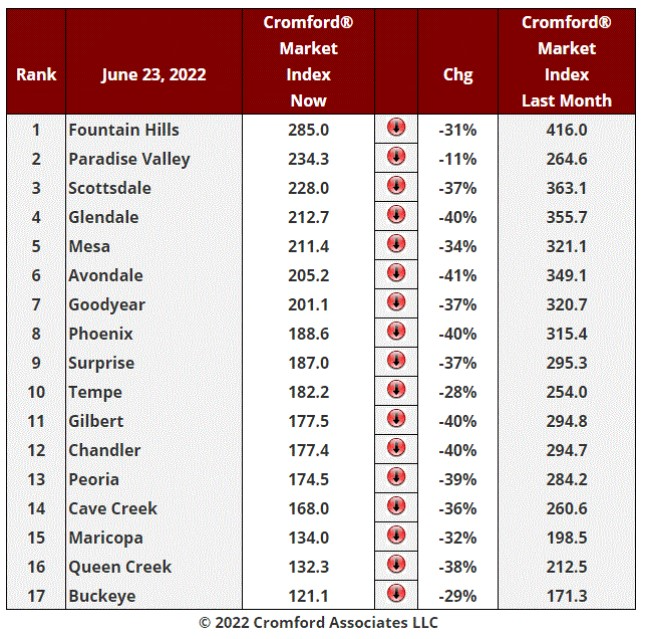
This table is a little worse than we were expecting. Of course we anticipated all 17 cities would be in the red, but we thought it was possible that the rate of decline might ease up. Instead the CMIs are falling at the same rate that we measured last week, which is -35% per month. It goes without saying that this is a very negative indicator for the entire market.
As in all previous downturns, the worst affected spots tend to be the lower-priced outer areas, such as Maricopa, Queen Creek (especially the unincorporated Pinal County areas that make up San Tan Valley) and Buckeye. Buckeye is one week away from a balanced market and if the trend continues without hesitation, three or four weeks away from a buyer's market. The supply of active listings in Buckeye is now higher than the long-term average. Demand is falling, but only slowly. It is the supply of homes for sale in Buckeye that is starting to get out of hand. Up 9% in just the last 7 days and up 374% from this time last year. With the latest increases in mortgage rates, we could see another step down in demand in Buckeye and things could then get really ugly for sellers.
The situation looks hardly any better in Queen Creek and Maricopa. Maricopa's supply now exceeds its long term average and it is less than 2 weeks away from a balanced market. Queen Creek remains well below its long term average for active listings, but the situation is deteriorating rapidly for sellers. Available active listings are up 209% from last year and up an astonishing 347% from three months ago.
Among the higher-end areas, Cave Creek seems to have lost more of its mojo than Fountain Hills, Scottsdale or Paradise Valley. We still have 7 cities with CMI readings over 200, but this will not last long if current trends persist. Only Paradise Valley looks likely to stay above 200 for any length of time. Supply in Paradise Valley has so far stayed quite low compared with all other areas.
The largest percentage CMI declines are to be found in Avondale, Glendale, Gilbert, Phoenix, and Chandler, all down 40% or more and representing a huge percentage of our total market. Peoria, Goodyear and Surprise are all 37% down, so not significantly better.
The chance of a balanced market within a couple of months is now very high and the chance of entering a buyer's market a short time later is increasing with every day. The speed of change is unprecedented and dangerous to both participants and forecasters. With another 75 basis point increase in the Federal Funds Rate suggested for July, the bad news for the housing market just keeps coming.
Jun 22 - If you would like to study iBuyer purchase numbers, sales numbers and gross margins in detail, the appropriate charts can be found in the Cromford® Public section of this site.
For several years, we published a monthly summary of iBuyer activity within this Daily Observations section, but that fell apart when Zillow decided to allow its in-house title company to contravene Arizona statutes and fail to file Affidavits of Value for the homes it sold in bulk. The exemption it claimed only applies when homes are sold between subsidiaries of a single parent company for no or negligible consideration. This often happens within different subsidiaries of developers. That exemption did not apply to Zillow selling to institutional investors. However the state of Arizona did not take any action and we are left with no affidavits for hundreds of homes that passed through Zillow's ownership.
We now intend to publish occasional summaries of activity for individual iBuyers where we hold reasonably accurate data. Since they are no longer in the iBuying business, we can safely ignore Zillow. We will also ignore small players like Redfin and focus only on the larger iBuyers - Opendoor and OfferPad. Today we will take a quick look at OfferPad, based on their ARMLS listings rather than their recorded deeds.
Below is a chart showing active listing counts for OfferPad so far in 2022 together with listings under contract (Pending or Active-UCB).
On June 21, we can see 242 active OfferPad listings plus 6 in UCB status. There are also 65 pending and 4 temporarily off market. This gives OfferPad a contract ratio of only 29. This is a rather weak reading and the lowest we have seen for OfferPad since the end of 2018. It indicates that the market in OfferPad-owned homes is cool. I suspect they may be concerned that it could take a long time to sell their large inventory in current market conditions.
Everything was going pretty smoothly until April, but the rapid rise in active listings with no corresponding rise in listings under contract suggests that OfferPad no longer has a challenge in the buying department. Its difficulties now lie in selling.
These statistics also indicate that the situation for OfferPad may have changed even more dramatically than for the market as a whole. If we look at their contract ratio over time, it has dropped from a very healthy 219 on March 20 to a good 124 on April 20, then an average 49 on May 20 to a weak 29 on June 20. Their business in Greater Phoenix has transitioned from hot to cold in 92 short days. I suspect they may regret buying quite as many homes as they did since March. How will they respond to this sudden and unexpected challenge? I would not be surprised to see them cancel some of their existing contracts or come back with lower price offers than they previously made. They may even call a temporary halt to new buying, while they reduce their current inventory to manageable levels, given a much slower sales rate. According to affidavits, they sold 55 homes during May and 21 month-to-date in June. With 242 homes active, they now have more than 6 months of inventory at their current rate of sales. To sell these homes, they may have to resort to price cuts sooner rather than later. The observations are pure speculation, and I am obviously not privy to their internal business processes, but their excess of supply over demand will probably require some creative changes in strategy.
Sudden changes in the market conditions pose challenges for everyone and the iBuyers are not isolated from these difficulties.
Jun 21 - Another look at the plummeting CMI daily chart shows just how far down we have come from the red-hot market of January and February: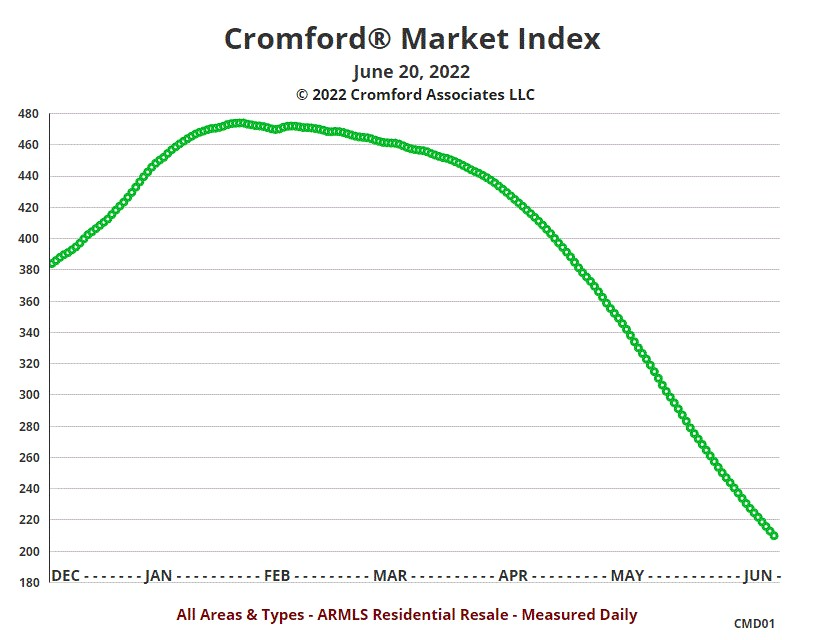
There is just a glimmer of positive news from this chart, however. The rate of decline in the CMI has peaked and is now starting to fall very slightly. The highest rate of decline was 9.12% per week during the second week of June. This has now eased a little to 8.94% per week. This is still pretty bad for sellers and the market as a whole, but at least it has stopped getting worse at an accelerating rate. Once this trend consolidates, we would expect the weekly rate of decline to keep dropping.
If the current trend continues, we would see the CMI hit 110 on August 14 and 100 eight days later. We would enter a buyer's market in the first week of September. Of course, this is just one of billions of possible scenarios and we do not pretend to know what will actually happen. Demand could improve or get worse tomorrow and supply is equally unpredictable. You cannot foretell the future, but you can study the present. Most market observations you will see elsewhere are one to three months old. This is why we measure the market every day rather than waiting until the end of the month.
What is looking unlikely at the moment is that closing prices will move significantly higher than they already are. We are at the wrong time of year for that, even if the CMI were not falling. The summer months almost always see a consolidation or fall in average closing prices because the luxury market contributes less to the averages between June and September.
There is still an excess of demand over supply at the lowest end of the market , which include a larger proportion of condos and townhomes. Homes over $2 million remain in low supply compared with a normal market, even though demand is down. It is the middle of the market, between $400,000 and $1 million, that is seeing the largest amount of extra supply and a huge drop in demand. This includes the bulk of new homes, which are now appearing on the MLS in much larger numbers than 3 months ago. If the CMI measured just this mid-range price sector, it would be showing lower numbers than the chart above. The mid-range is likely to become a balanced market before the low-end or the high-end.
Jul 20 - The number of new listings added to the ARMLS database over the past 28 days is 11,845. Why is this significant? It is because it is the highest number added in any 28 period since we started measuring this statistic in 2011.
The long term average is 8,845, so we are currently getting 34% more new supply than average.
If we were just suffering deflating demand, the market would be cooling off gently. But if 34% more new listings are arriving every 4 weeks, supply is increasing just at the wrong time and it just cannot be absorbed. This is why we are seeing the fastest cooling trend that the Greater Phoenix housing market has ever experienced. What we do not know is whether the extra listings will keep coming or if this excess new supply will dry up sooner rather than later.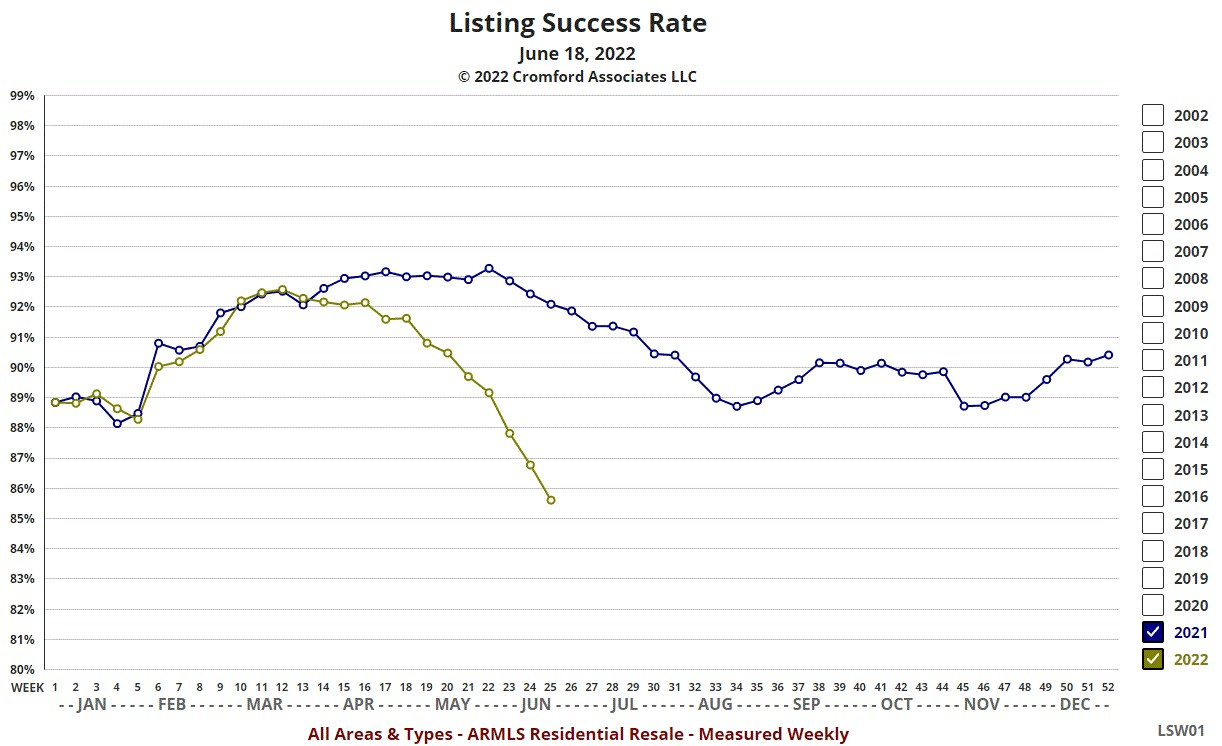
Jul 19 - Zillow still sends me frequent emails about the home in Mesa that I moved out of in 2017 and sold in 2018. It has changed hands twice since I lived there, but that somehow seems to have escaped their notice and they think I might be planning to sell it..
They are now telling me they expect the value to increase by 16% over the next 12 months. Bless them!
If this is the kind of forecast their algorithm produces, it was definitely a wise idea for them to leave the iBuying business.
Jun 18 - High prices and interest rates are keeping a lot of potential home buyers out of action at the moment. In addition, deals in escrow are starting to fall through in larger numbers. Both these trends are causing the count of listings under contract to head downwards. Here is the weekly chart for listings under contract for all areas & types in the ARMLS database.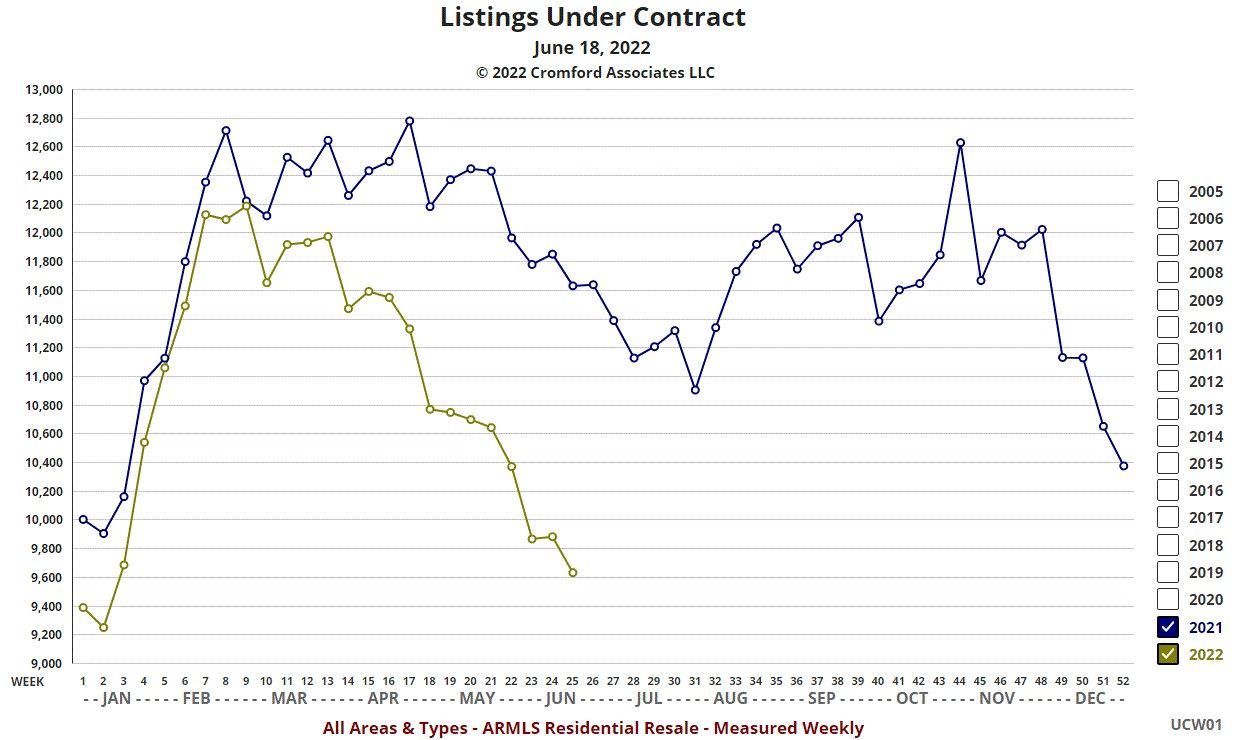
You can see that in June we are below the level of the third week of January. This is previously unheard of and indicates very poor demand for the time of year. In fact we have to go all the way back to 2008 to find a mid-June reading as low as this.
Some buyers are backing out of contracts they have already made. Others are offering much lower prices than originally agreed, sometimes just as escrow is due to be closed. In England we have a word for this - "gazundering". Google it, if you don't believe me. It has very negative ethical connotations, but it is legal.
These are all signs that our long-term seller's market may be coming to a rapid conclusion. Some iBuyers and institutions, who came to the market's rescue in 2021, are joining the stampede we wrote about yesterday. The larger the herd, the more dangerous the stampede.
Jun 17 - Those who have joined the real estate market in the last 10 years may not have fully realized that the housing market is always cyclical. Every time there is a long term positive cycle, people say "this time it is different" but the cyclical nature of housing is caused by human nature, which can always be relied upon to assert itself eventually. Much harder is trying to forecast exactly when human nature will do its party trick. When times are good, greed gets the upper hand and when times turn hard, fear takes over and wrecks everything. Greed in the housing market was the primary cause of the Great Recession of 2008. Greed caused people in 2004 through 2006 to do all sorts of crazy loans with dodgy lenders and crooked borrowers equally to blame. When prices stopped moving higher (they always do stop at some point) all those loans fell apart, supposedly safe Mortgage-Backed Securities collapsed in value and fear took over the market. This was actually a slow moving train wreck that ran from 2004 through 2011.
The situation in 2022 is very different, yet similar in some important ways. Many people have made a lot of very large paper profits in housing over the past 10 years, without having to resort to loan fraud. Those profits have been especially large in the last 2 years. What is driving the market today is fear of those profits disappearing. If they sell now, those paper profits become hard cash, always useful when the rest of the economy is going a bit wonky. Or they can be converted into different assets using a 1031 exchange. Hard cash profits incur capital gains tax, so the 1031 exchange looks an attractive way to avoid that tax. However, if you exchange into something that is exposed to the same market risks, your profits stay at risk too. Cash can be exchanged for almost anything (not love, though). But cash itself, is still a poor vehicle to store wealth when inflation is running at close to 10%. If we were all logical, it would make some sense for everyone to stay invested in the housing market and sit tight. But we are not all logical. Fear will cause some people to sell and those people can easily spook more people and with the social media environment we now inhabit, a stampede is happening almost as soon as you realize what is going on. The promotion of disaster stories gets a lot of clicks and clicks reward the poster no matter how untrue their content might be. You could say it is logical to be fearful, because fear is highly contagious.
Fear of the market going down can become a self-fulfilling prophecy. If there is a stampede, injuries occur. An orderly exit is almost impossible to engineer. Human nature makes everyone want to do the same thing at almost the same time.
What started as an orderly cool down in March quickly turned into a flight to safety in April and May and now we seem to have a stampede for the exits developing in June. The rise in interest rates was a signal for this to happen. It was not the only cause, because if supply has stayed low, it could have coped with a significant fall in demand. But it is not just lower demand we are facing, but far higher supply because of the rush of home owners wanting to exit the market. New listings are coming from all directions.
Economic forecasters like to claim that when interest rates rise, home prices go down. That assertion can easily be disproved by detailed research into interest rate and home price history. At this stage I like to quote Ezra Solomon "The only function of economic forecasting is to make astrology look respectable." This quote is often wrongly attributed to John Kenneth Galbraith - he did say it in 1988, but he was quoting Ezra Solomon in 1984). Another human trait is to attribute any quote to the most famous person who said it, not the original creator, but I digress. Being correct does not help when a stampede is headed your way.
If people want to believe it, dramatically rising interest rates will cause people to believe that home prices are going to fall, and because they believe it, and act on that belief, home prices can sometimes fall as a result of interest rate rises. Usually they don't, but sometimes they do. The times they do is when they cause a stampede. It is not yet clear whether this stampede is going to become big enough to cause home prices to fall in a significant way. It is clear that they could, but it is not clear that they will. It depends on the size of the herd stampeding.
Of course, if you live in your home as an owner of a primary residence, you are probably not going to join the stampede. But a LOT of people have been tempted to buy second or third homes by the thought of them appreciating. Selling one or two of them might make perfect sense. A LOT of people have become private landlords and have a collection of rentals. Selling the ones they like the least might make perfect sense. A lot of people have started operating short-term rentals and their houses have turned into a business, effectively becoming small hotels. This has driven up values and reduced the stock of ordinary homes. It is possible that fear could spread to these owners and some of there short-term rentals could come back into ordinary home supply just at the wrong time. These are all wealthy people not ordinary people, so the herd is not huge.
The biggest impact could come not from these small real estate owners (investors), but from the bigger players. Large scale institutional buyers of homes to rent, such as Invitation Homes, Progress Residential, RoofStock, American Homes 4 Rent, etc. have gobbled up a lot of ordinary affordable homes across Greater Phoenix, especially in the last 15 months. If these players decided to stop buying, it would create another big hole in demand, just as demand is already sinking. The amplification of the downtrend could be destructive in ways we have never witnessed before.
I just heard today that one of these big players has cancelled every purchase they have in escrow, forfeiting their earnest money in order to not complete their purchases. This is ominous.
Jun 16 - Here is our latest table of Cromford® Market Index values for the single-family markets in the 17 largest cities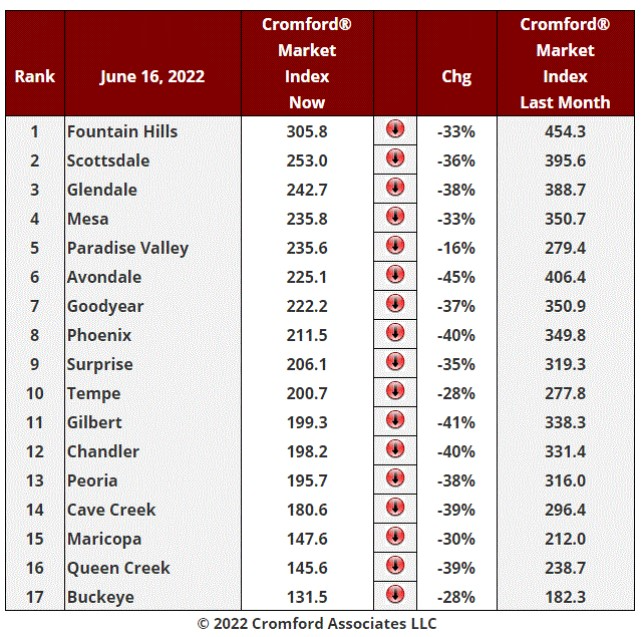
The Greater Phoenix housing market continues to weaken and the trend is still accelerating, with an average CMI decline of -35% which compares unfavorably with -34% last week. The luxury market is cooling but at a slower rate than the mid-range. Paradise Valley is easily the best performing city in the top 17 but has still seen a decline of 16% in its CMI. Fountain Hills and Scottsdale are tumbling by 33% or more but are the strongest markets in the list.
Maricopa, Queen Creek and Buckeye are much easier places to find new homes and the builders have been far more enthusiastic about putting their homes onto the MLS over the past two months. They are also more generous with buyer broker commissions. This only happens when they are concerned about a shortage of demand. Higher interest rates have taken a lot of buyers out of the market, but at least the ones who remain active will be getting more respect and personal attention. They may even be getting some concessions.
The largest declines are to be found in Avondale, Gilbert, Phoenix, and Chandler, all down 40% or more since this time last month.
At 131.5, Buckeye is getting close to a balanced market. At the current rate of decline, its CMI would fall below 110 by the end of June. Queen Creek and Maricopa are about 10 days behind and are likely to become balanced markets during July.
Jun 15 - As an indication of how far demand has collapsed in the last few months, the number of pending listings of all areas & types in the ARMLS database is 6,873. This is the second lowest number we have ever recorded for mid-June, beaten only by June 15, 2007. June is usually a strong month and we would normally expect counts to fall from June through the rest of the year.
We have been saying for several years that the imbalance in the market was caused by very low supply, not unusually high demand. This is illustrated by the fact that a sudden increase in mortgage interest rates can drop the demand to almost record lows.
Jun 14 - With demand down and supply growing, the upward pressure on pricing is dissipating very quickly. This is best measured by the average price per sq. ft. The readings move at different points in the cycle.
1. First to change are list prices for active listings, as sellers start to compete with each other by lowering their asking prices.
2. Second to change are list prices for listings under contract, as the better deals go under contract sooner than over-priced homes.
3. Last to change are prices for closed listings, since their contract prices were determined a month or two prior to close of escrow.
At the Cromford® Report, we like to measure these things on a daily basis. Hence the chart below, which covers six months. The figures for closed listings use the average for listing that closed in the immediately preceding monthly period. On June 13 this means listings that closed between May 13 and June 12.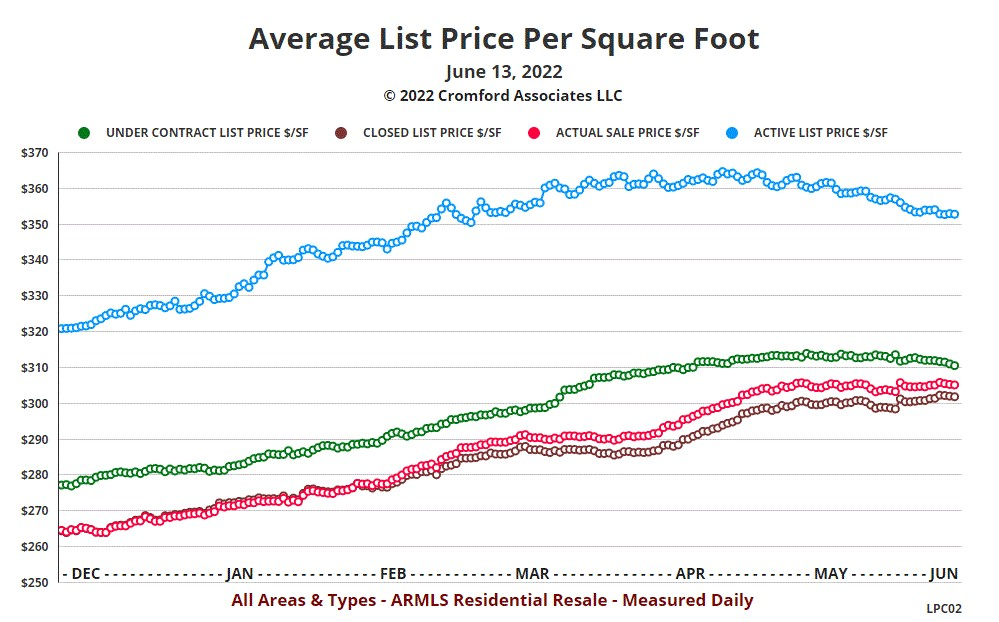
This chart has many very clear messages if we take the time to read them:
1. Asking prices are coming down. They peaked on April 27 at $364.81, then gradually started to ease. They are drifting downward and are currently hovering around $353.
2. Under contract prices are also coming down. They peaked on May 14 at $314.06 and have now settled back to $311 with a gentle downtrend established.
3. Closed pricing has moved mostly sideways since the beginning of May, but the high point reached so far was $305.97 on June 10. The is little sign of them going over $306 and as the under-contract prices decline, this will severely limit any upside to closed prices. The red line will always tend to stay below the green line.
4. The list price for closed listings is still rising a little, because the achieved percentage of list is falling.
In a normal market, the red line is always below the brown line (that is, most buyers pay less than list price), but right now the average closed sale went for about 1% more than the asking price. This situation probably will not last much longer.
If current trends continue, we may very well see the average price of closed listings start to fall, while still staying slightly higher than the average list price of those closed homes. This is something I would have previously believed as rare as a unicorn. It can only happen when the change from hot to cold is as fast and violent as we have seen between mid-April and June 2022. This has not been observed since we started measurements in 2000.
Anyone who is planning to sell their home today needs to understand that their property is no longer likely to appreciate in the months ahead. Be grateful for the incredible surge in its value over the past several years, but all good things come to an end.
Jun 13 - The Cromford® Market Index has plunged by over 50% over the last 3 months without losing any of its downward momentum. Most of that fall took place in the last 9 weeks
This is a very negative indicator for the housing market and with mortgage interest rates moving sharply higher again, there seems to be little chance of a recovery in demand that would quickly pull the CMI out of its steeply diving trajectory.
If the next 2 months look a bit like the last 2 months then we could hit the balanced zone for the CMI between 90 and 110 during August. Readings below 90 denote a buyer's market.
It is a surprise to no-one that demand should fall after a sudden and large increase in mortgage rates. This would normally cause a slow increase in supply. However we have witnessed a fast increase in supply, due to a significant increase in the arrival rate of new listings. It is not so obvious why the number of new listings would rise at an elevated rate. Clearly people are choosing to exit the market - sell a property without buying a replacement.
Where are all the extra listings coming from?
Those with homes that they do not actually need are likely to be the first to sell. These include:
wealthy people with multiple homes who can easily do without their Arizona getaway
landlords with multiple properties who would like to reduce their exposure by selling one or more of their investment properties
short-term rental owners (Airbnb style) who can quickly cancel their bookings and exit the market if they see risky times ahead
Long-term rental owners take slightly longer to sell up if their properties are occupied by tenants. If they are empty, then it is easy and quick to add the homes into the for-sale inventory.
The new supply is not distressed and owners will be looking to achieve top-dollar. However, they may be feeling an increasing sense of urgency the longer the market cools. So selling for slightly less is better than not selling at all.
Jun 12 - New home inventory is growing even faster than re-sale inventory, at least in percentage terms. Comparing June 12 with March 12, 2022
Active listings with date built 2023 are up 222% to 103 - these are homes that will not be available to close until next year and many of them are very expensive. More than 57% of them are priced over $1 million and 5 are over $10 million
Active listings with date built 2022 are up 213% to 1,147 - these new builds are either spec homes or build to order (BTO) with delivery by the end of the year
Active listings with date built 2021 are up 36% to 242 - new homes that have already been completed last year or are being flipped very early in their life
Active listings with date built prior to 2021 are up 128% to 9,985 - not new, but re-sales
Developers are clearly using the MLS more than they did 3 months ago.
New home listings are piling up on the MLS inventory faster than re-sales, but re-sales are still growing very fast even without the new homes.
In percentage terms, homes built in 2021 or later represent 13% of ARMLS listings on June 12, up from 11.6% on March 12.
We expect to see buyer-broker commissions on new homes get more generous as time goes by.
Jun 11 - Inventory continues to build at an astonishing rate. This is easy to see using the weekly active listings chart:
Buyers are now seeing between 800 and 900 more active listings to choose from every week. If the trend continues at this frenetic rate we could reach market balance as soon as mid-August. But will it continue? We do not pretend to know the future, but when a trend is this strong it tends have pretty good staying power.
If we compare today (June 11) with 3 months ago (March 11), we can see that:
active listings across all areas and types have grown 138% from 4,820 to 11,471
active single-family detached listings have grown the most - 148%, with townhouse / condos up 139% and mobile homes only up 28%
active Greater Phoenix listings are up 140% while out-of-area listings are up 121% with Apache County up 312%, Coconino County up 232%, Gila County up 164%, Navajo County up 134% and Yavapai County up 124%
homes priced between $400,000 and $1 million are up 183%, while homes between $1 million and $2 million are up 163%
homes priced less than $400,000 are up 69% while homes over $2 million are up 59%
In these numbers we have excluded UCB and CCBS active listings.
Due to the increased competition among sellers we are seeing a large jump in the number of list price reductions. Sellers' less lofty ambitions are also reflected in the average price per sq. ft. for active listings which has retreated from a peak of $364 in late April to $353 today. The price per sq. ft. of pending listings is flat-lining around $310 and showing little momentum to break through its peak level of $314 achieved in late May.
In 2005 it took a long time for people to realize that prices would not necessarily go up forever and despite a rapidly deteriorating market, it was not until mid 2006 that sale prices started to fall. The deterioration in 2022 is much faster than in 2005 and people are primed to believe that price declines are likely, if not inevitable. The willingness to believe in price declines may compensate for the absence of homeowner distress - foreclosure notices remain close to record low levels.
It is looking possible that $305 to $310 will be a top in average sales price per sq. ft. and anyone expecting closing prices to continue rising much beyond their current level is likely to be disappointed.
Jun 9 - Here is our latest table of Cromford® Market Index values for the single-family markets in the 17 largest cities
This table tells us that the cooling market trend is still accelerating, with an average CMI decline of -34% which compares unfavorably with -33% last week. Demand continues to fall in most areas but the dominant effect is now the rise in supply, with new listings arriving at a pace that is well above average. Paradise Valley has seen little change in its supply over the last month, thought demand is still trending lower. At -18% it is the top performing city in the table.
The largest declines are to be found in Avondale, Gilbert, Cave Creek and Chandler, all down more than 40% since this time last month.
We now have 4 cities below 200 and at 143.6, Buckeye is not far from a balanced market between 90 and 110. Maricopa and Queen Creek are racing towards that zone too.
The upper end of the market is slowing, but to a lesser degree than the mid-range between $400,000 and $1 million. This effect is placing Fountain Hills and Scottsdale at the top of table.
Supply below $400,000 remains very low and that segment of the market remains strong.
Jun 8 - The rental market, as represented by ARMLS rental listings, has cooled since this time last year.
During May 2021:
1,473 leases were closed
74.1% leased at asking lease price
18.3% leased below asking lease price
7.6% leased above asking lease price
Median closed lease = $1,900/month
During May 2022:
1,954 leases were closed
53.5% of rentals were leased at asking price
41.6% were leased under asking price
4.9% were leased over asking price
Median closed lease = $2,200
The rental listings on ARMLS are not a balanced cross-section of the rental market. They tend to be skewed towards higher-end properties and single-family homes rather than relatively affordable apartments. However we have to work with the data we have, rather than the data we wished we had.
Although the median lease price has increased over the 12 months, far more listings are leasing below the asking price and far more listings are appearing on the ARMLS database. Landlords do not bother to list their properties on the MLS if they expect them to lease up very quickly and easily. So the fact that we are seeing a 40% increase in new rental listings compared with 2021 shows us that landlords are less confident than they were a year ago.
Rental prices has not changed a lot in the last 5 months and the median lease price seems to have hit a stable patch around $2,200.
As of June 5th, 2022, there were 2,385 active vacant rental listings in the Arizona Regional MLS, up 26% since January 1st, 2022 and up 79% since September 1st, 2021.
All these statistics exclude short-term rentals.
Jun 6 - The initial Maricopa County affidavit counts are in for May and they tell us the following:
There were 10,268 closed sales - down 11% from May 2021
There were 1,615 new homes closed - down 12% from May 2021
There were 8,653 re-sale homes closed - down 11% from May 2021
The overall median sales price was $490,000 - up 24.8% from May 2021
The new home median sales price was $500,490, up 27.8% from May 2021
The re-sale median sales price was $486,000, up 23.7% from May 2021
All the numbers include single-family and townhouse/condo properties.
Although sales volume are down substanmtially, closed prices continue to move substantially higher. The overall monthly median sales price climbed 2.2% between April and May.
Jun 4 - Since the market downturn started we have seen all of the early dominoes fall. If we were in a non-serious situation, then there are several middle-ranking dominoes that would not topple and the early ones would start to stand upright again.
But instead, we are starting to see the middle-order start to wobble and fall over. Here is one of them - the number of closed listings per month, measured on a weekly basis.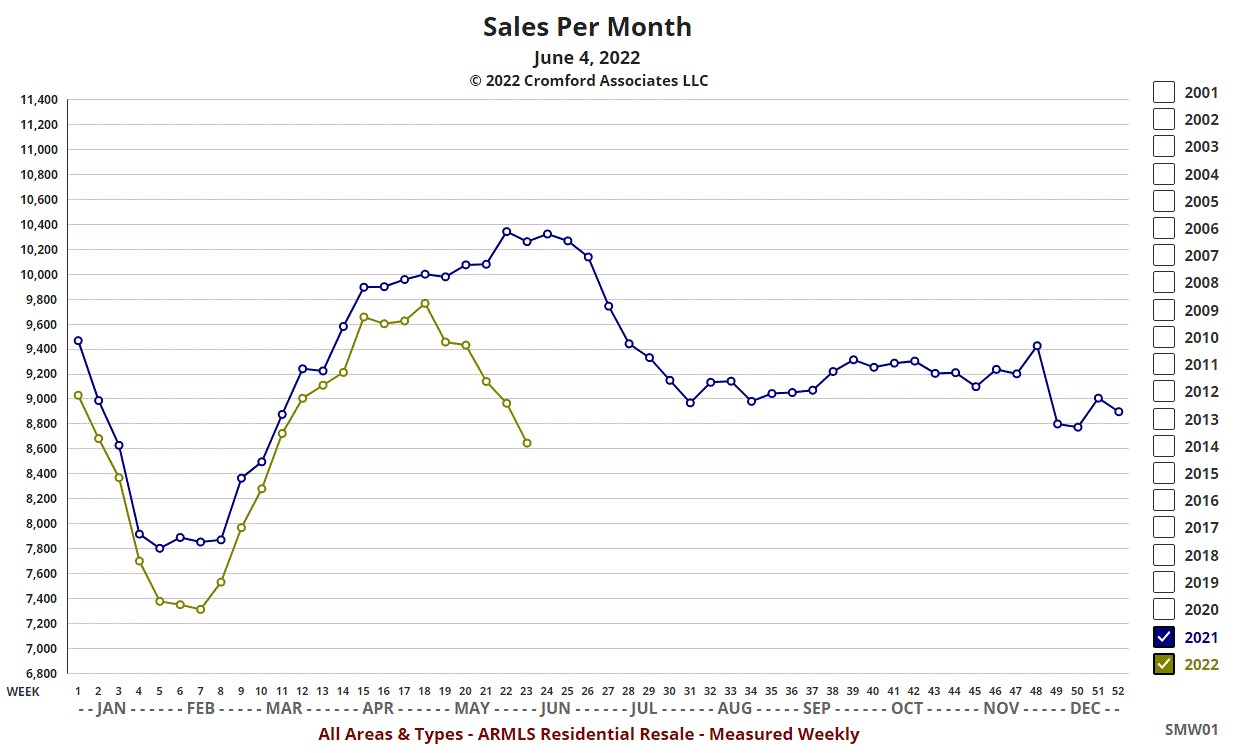
2022 had been running behind 2021 all year, but not by a large amount. Up until late April, the sales rate was not of concern. Then in May things got worrisome. The 2022 sales rate took a sharp dive and is now 16% below the reading in 2021.
This leads me to conclude that the market is serious about this change of direction and the new trend is likely to continue for some considerable time.
Last year we saw a sales reduction in July, but this is normally when sales rates start to drop for seasonal reasons (Phoenix gets very hot in May). Thanks to large investors and iBuyers, the closing rates recovered during the rest of 2021.
There two things that concern me about the sales decline in 2022
It is taking place in May, which in a healthy market should be one of the busiest months for closing
We are seeing a very steep drop in a short period.
In this environment, selling a home is no longer like falling off a log. Showings will be fewer in number and offers far less easy to get than they were in March. Once buyers realize what is going one, expect them to start flexing their negotiating muscles. They might even ask for the seller to pay for a Home Warranty (shocking I know).
Jun 2 - Here is our latest table of Cromford® Market Index values for the single-family markets in the 17 largest cities

This table tells us that the cooling market trend is still accelerating, with an average CMI decline of -33% which compares unfavorably with -28% last week.
The weakening demand and rising supply now applies to almost every market segment, and certainly to all 17 of the largest cities. Paradise Valley saw the smallest decline in its CMI but it is still down 22% compared to a month ago. The worst affected are Avondale, Gilbert, Queen Creek and Cave Creek, all down by 37% or more, while Phoenix is down 35%.
No city is over 400, even though, back in March, 14 of the 17 cities were over 400. March feels like a very long time ago.
Sellers need to be fully aware of how much of their advantage has disappeared. Be nice to buyers.
Jun 1 - We issued a red flag warning on April 24 and in the 5 weeks since then the market has deteriorated at the fastest rate we have ever seen. The Cromford® Market Index is 272.2 today, but it stood at 406.2 on April 24, so it has plummeted by one third in just 5 weeks. On May 1, the CMI stood at 385.2 so it has dropped 113 points over the month. This is by far the largest monthly decline we have ever seen in the CMI.
We admit to being surprised at how quickly the market is cooling. We expected a downward trend but did not anticipate it would be so dramatic. The softening trend is now very well established and momentum is strong. We will shortly be entering the third quarter, usually the weakest time of year for the Greater Phoenix housing market. Even in a good year, prices tend to drift lower during the third quarter. We are not having a good year, despite the incredible strength of the first quarter.
Supply is growing fast
Demand is weakening
Sales volumes are in swift decline
More asking prices are being lowered
Listing cancellations and expirations are starting to rise
The last time we saw a similar frenzied market cool down very quickly was in April to November 2005. This is a more striking reversal than we experienced that year.
May 31 - The latest S&P / Case-Shiller® Home Price Index® numbers were published on May 31.
The new report covers home sales during the period January to March 2022. So they do not reflect sale since April 1, 2022, nor the market slowdown we have experienced over the past 2 months.
Comparing with the previous month's series we see the following changes:
1. Seattle +5.57%
2. Denver +4.47%
3. Dallas +4.30%
4. San Francisco +4.26%
5. San Diego +3.74%
6. Tampa +3.68%
7. Miami +3.64%
8. Los Angeles +3.27%
9. Atlanta +3.15%
10. Las Vegas +3.10%
11. Phoenix +2.98%
12. Charlotte +2.91%
13. Portland +2.88%
14. Washington +2.86%
15. Boston +2.62%
16. Detroit +2.62%
17. Cleveland +2.34%
18. Minneapolis +2.07%
19. New York +1.60%
20. Chicago +1.51%
Phoenix has dropped another place to 11th but remains above the national average, which was 2.55%. No sign of a slow down here, but we would not expect any. Sales prices are a trailing indicator and these are all from the first quarter of 2022.
Comparing year of year, we see the following changes:
1. Tampa +34.8%
2. Phoenix +32.4%
3. Miami +32.0%
4. Dallas +30.7%
5. San Diego +29.6%
6. Las Vegas +28.5%
7. Seattle +27.7%
8. Charlotte +26.0%
9. Atlanta +25.7%
10. San Francisco +24.1%
11. Denver +23.7%
12. Los Angeles +23.2%
13. Portland +19.3%
14. Detroit +15.4%
15. Cleveland +14.7%
16. Boston +14.6%
17. New York +13.7%
18. Chicago +13.0%
19. Washington +12.9%
20. Minneapolis +12.4%
The national average was 20.6%. Phoenix has finally been toppled from the top spot by Tampa. Phoenix spent a total of 33 consecutive months at number one, establishing a new record.
May 28 - After a surprisingly rapid rise in inventory over the previous 5 weeks, last week's increase was relatively modest.
Although still a beefy jump from 30 to 32.2, this was noticeably smaller than the prior 2 weeks and could possibly (?) indicate a slowing of momentum in the cooling trend.
There are very uncertain times, so optimists will probably view this chart favorably. However it also shows that inventory has almost doubled from 16.4 to 32.2 days between mid March and late May. Pessimists can rightly claim that is still a faster increase than we saw in 2005, the last year in which we experienced a similar sudden change following a buying frenzy.
If days of inventory returns to the 120 to 140 area then we will have seen the market return to a normal balance, but if it stays well below that (say 50 to 60) then the seller's market will have survived and upward pricing pressure will still persist.
May 26 - Here is our latest table of Cromford® Market Index values for the single-family markets in the 17 largest cities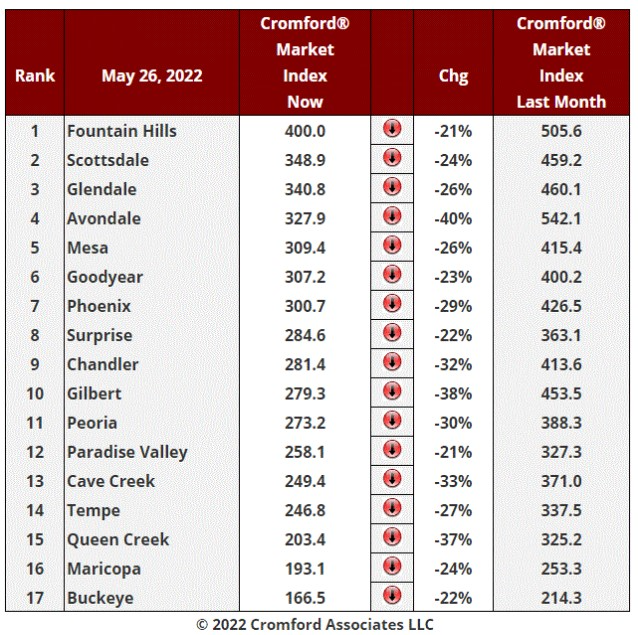
The decline in CMI values is still accelerating with an average monthly change of -28% compared with -24% last week. The pace at which the market is cooling off is both astonishing and widespread. Least affected are the active adult areas such as Sun City, Sun City West and Sun Lakes, none of which are big enough to appear in the above table.
The largest declines over the past month have been seen in Avondale, Gilbert, Queen Creek, Cave Creek and Chandler. The smallest declines can be found in Paradise Valley and Fountain Hills but even here the fall is a massive -21%.
Only 7 cities are still over 300. There were 15 a month ago.
Buckeye is interesting in that demand has actually improved over the past month. However supply continues to build quickly and overwhelms that effect.
In absolute terms 166 to 400 are all seller's market CMI numbers, so we are not yet close to the point where buyer's have an advantage. However buyers' disadvantage in negotiations has dropped dramatically. This is because there is much less competition from other buyers. Many of these have dropped out due to the eye-popping increase in mortgage rates. There are also many more homes to choose from compared with a couple of months ago.
Cash buyers remain active, but these are a much smaller part of the total demand and cannot compensate for the loss of financed buyers.
May 23 - Every leading indicator is pointing to a sharp slowdown in the Greater Phoenix housing market. Supply has increased very quickly over the last 2 months while demand is much weaker than it was in March.
Prices are much slower to react to a change in the market, especially closed sale prices. However prices for homes under contract react 1 to 2 months earlier than closed prices. Even sooner than that we would expect to see weakness in asking prices. This is now starting to appear as sellers gradually lose confidence. Some sellers will be in denial for many months yet, and will risk over-pricing their home in current market conditions. Others will be more reactive and make sure their asking pricing is competitive.
Here is a chart showing daily average price per square foot for 4 measures:
1. List prices for active listings as of May 23
2. List prices for listings under contract as of May 23
3. List prices for closed listings during the last month (Apr 23 - May 22)
4. Sale prices for closed listings during the last month (Apr 23 - May 22)
We can see that the average $/SF for active listings (the blue line) has not managed to break through $365 and is now showing signs of retreating below $360. The maximum was $364.81 achieved on April 27. This is probably going to be the top.
The green line is for listings under contract and has not yet shown any weakness. However, it is not showing much willingness to move above the current level of $313 to $314. This is probably close to the top, though we are by no means certain of this.
The closed prices are still blissfully unaware of the change in market conditions. The sale price per sq. ft. remains higher (at around $305) than the list price (around $300). However if the green line starts to drift lower we would expect the red and brown lines to do the same. Eventually the red line will drop below the brown line in a signal that market has returned to normal.
The remarkable speed of the change in the market is reflected in the fact that the Cromford® Market Index has dropped over 100 points in the last month.
May 21 - The Greater Phoenix market continues to provide plenty of reasons to be worried. Another domino is wobbling and looks like it might be getting ready to fall - the listing success rate. Below is the weekly chart for all areas & types.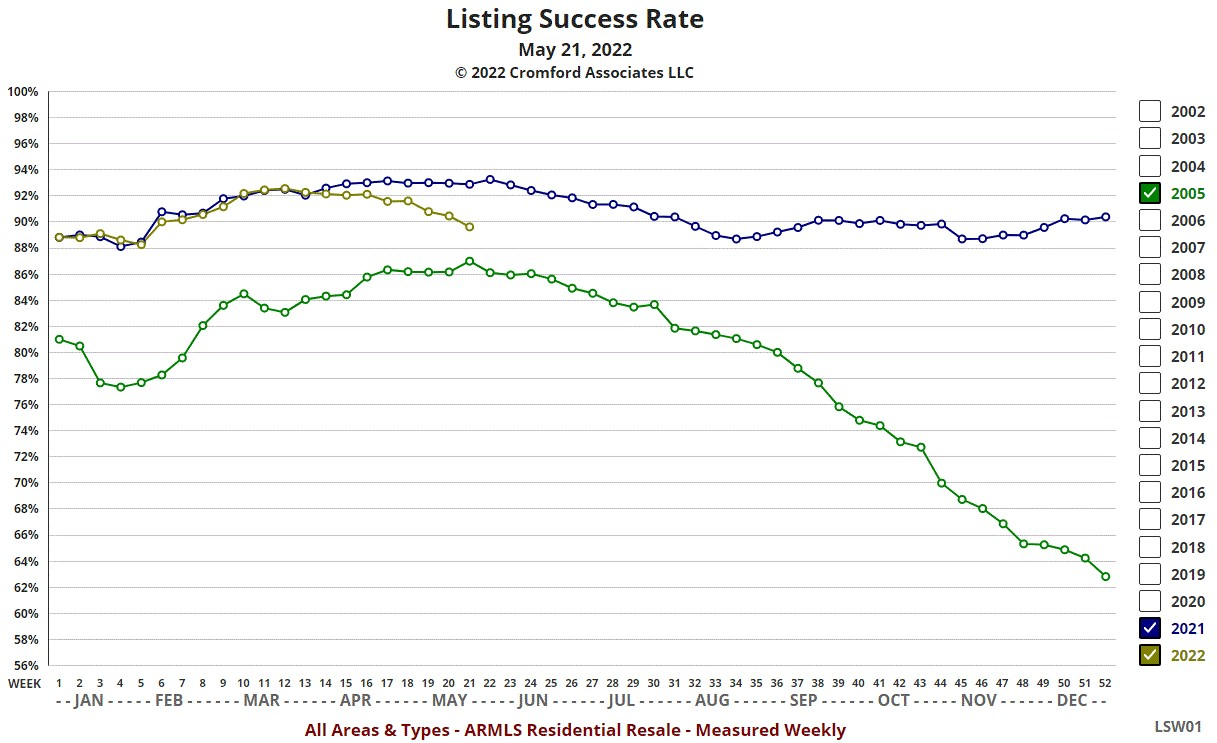
At the moment we are just under 90%, a very strong number. However, if we look at the last 5 weeks, a clear weakening trend has started. A similar trend developed in 2005 between June and July. By the end of 2005 we were down to just 63% - meaning that 1 in 3 homes listed failed to sell. We cannot say this will happen in 2022. But if it were going to happen, the first signs of the success rate problem would look like just the chart above.
A similar downward trend started during the summer last year, but frenetic buying by investors, particularly large investors, pulled the nose of the airplane back up and we ended 2021 with a strong success rate of just over 90%. This does not look as likely in 2022. It would be advisable to watch this chart like a hawk. 2005 was a year full of red flags waving. 2006 was a full scale bubble burst. People now talk of the 2008 crash, but that was only when Wall Street woke up and entered a full-on panic. The real estate market was in dire straits as early as the middle of 2006 and 2007 was truly dreadful.
The problem that we faced in 2006 was compounded by all the foreclosures that piled up in 2007. This was largely because so many homeowners had little or no equity in 2006 so by 2007 they had negative equity and no reason to avoid foreclosure. At the moment, we have a more positive situation with a much higher percentage of homeowners having significant equity. They should be motivated to protect rather than abandon that equity. That gives us a reason to be less worried, but extreme vigilance is the order of the day. Those who refinanced and took a little too much cash out over the last 2 years are more exposed than most.
May 17 - Supply continues to increase at a fast rate across most market segments. The effect is most noticeable in the price ranges from $500,000 to $2,000,000.
For Greater Phoenix, single-family detached non-distressed listings without a contract:
Active listings priced between $500K and $600K have risen from 477 to 1,049 in the last 2 months (120%)
Active listings priced between $600K and $800K have risen from 546 to 1,111 in the last 2 months (103%)
Active listings priced between $800K and $1M have risen from 259 to 519 in the last 2 months (100%)
Active listings priced between $1M and $1.5M have risen from 209 to 468 in the last 2 months (124%)
Active listings priced between $1.5M and $2M have risen from 91 to 194 in the last 2 months (113%)
The rise in supply is quite modest for homes priced over $3 million or under $500,000. It is also hardly showing up in mobile and manufactured homes. It is quite obvious in the condo / townhouse sector.
May 15 - For years buyers have been crying out for more supply. Their wish is finally coming true. In the last 7 days we saw more than 3,000 listings added to the ARMLS residential database for the first time since 2010.
With demand dropping below normal, this torrent of new listings is growing our active inventory at the fastest rate since 2005. If you can afford the new interest rates (or are buying with cash), there are suddenly a lot more homes to choose from.
Look out for a list price cuts as sellers start to realize they have to be more realistic if they wish to compete. Asking for concessions is no longer a joke.
Sales price weakness is still a few months away, but asking prices are starting to look a little wobbly.
May 14 - It is time to look at another of the dominoes that have fallen over - the contract ratio. The contract ratio compares the number of listings under contract with the number of active listings without a contract. It is a classic case of comparing demand with supply. This ratio has plummeted over the past 4 weeks because demand has weakened while supply has increased sharply.
This tells us that the previously crazy hot market has turned into just a hot market. But it also tells us that if the cooling trend continues at a similar rate, we could be in a warm market within a month and a normal market in just 2 months. The former is very likely, the second is more speculative and anyone who tells you they know what the market will be doing in 3 months is kidding themselves.
Here is the contract ratio chart for single-family homes in Phoenix:
The fall from 250 four weeks ago to 145 this week is even more dramatic than the sudden drop we saw at the start of the COVID-19 pandemic. The drop in 2020 was quickly recovered and within two months we were back higher than we started. The current decline appears to have more staying power and momentum - and we can see that a drop back to 2018 levels is likely by the end of May.
2014 was the last time we had a market that was fairly "normal" so use that line for reference.
May 12 - Here is our latest table of Cromford® Market Index values for the single-family markets in the 17 largest cities
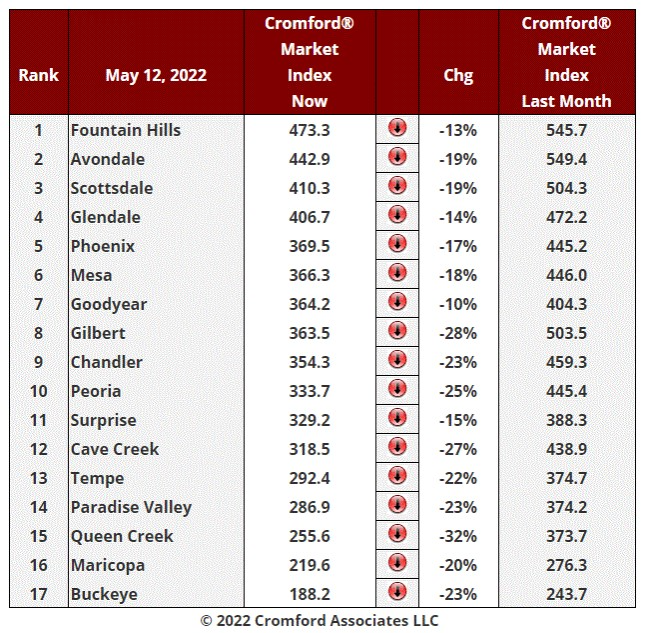
From a seller's perspective, this is dismal table. Your negotiation power is dissipating at a rapid rate. All 17 cities are cooling quickly and their CMI is dropping 10% or more over the past month. 9 cities have fallen by 20% or more over the last month and one (Queen Creek) by as much as 30%.
The average change was -20.5% compared with -18.1%.
Supply is growing in almost all areas thanks to a plentiful and growing flow of new listings, while homes are going under contract at a slower rate than we have seen for a long time.
It will take several months of this trend continuing to reach a balanced market, but this no longer looks like such a far-fetched idea.
May 11 - The reported intent of buyers has changed significantly over the past year. In Maricopa County, purchases for owner occupation as a primary residence have declined 19.4% between April 2021 and April 2022. Purchases as a second home have declined by 8.1%. In contrast, purchases to turn into a rental have increased by 8.5%.
Demand from investors for rentals now represents nearly 21% of all home sales. This is sure to be an undercount. Just a cursory inspection shows us that many unscrupulous investors are marking their Affidavits of Value as purchases of a primary residence, no doubt to attract lower taxes. It is perjury to enter incorrect information on an Affidavit of Value and each of these documents are notarized. However we are yet to hear of any government agency taking action to enforce the state laws surrounding Affidavits of Value.
May 9 - The Cromford® Market Index was the first indicator to sound the alarm about the current market direction. However we can now see several other early indicators fall like a sequence of dominoes toppling over.
The first we would like to highlight is days of inventory - 365 times the number of active listings divided by the annual sales rate. Here is the weekly chart

While all the numbers are low in absolute terms, the 2022 line is shooting skywards like a missile. This tells us that supply is increasing very quickly relative to demand.
At 24 days, inventory remains very low at the moment, but we have seen in the past (specifically in 2005) that 24 in April can grow to 82 by year end and over 200 the following summer. I am NOT saying this is going to happen in 2022 and 2023, but I am saying this trend needs to be watched very closely. A balanced market will have about 120 to 135 days of inventory and if we get more than 150 days we will be in a buyer's market, one where prices will tend to fall rather than rise.
My advice is to keep watching days of inventory like a hawk and react appropriately.
May 5 - Here is our latest table of Cromford® Market Index values for the single-family markets in the 17 largest cities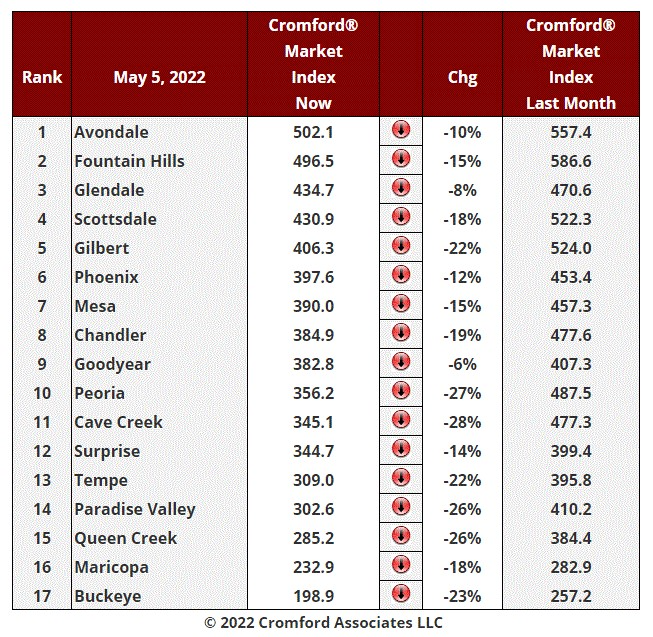
If you thought last week's table was bad, then this weeks is much worse. All 17 cities are cooling quickly with all except 2 (Glendale and Goodyear) dropping 10% or more over the past month.
The average change was -18.1% compared with -15.3%. More drastic cooling is observed in Peoria, Queen Creek, Paradise Valley, Buckeye, Tempe and Gilbert.
Supply is building quickly thanks to plentiful new listings and a major slowdown in homes going under contract.
The last 6 weeks look like the significant turn in the market than we have been anticipating for several years and there are no obvious upcoming changes expected that would reverse the current trend.
Because the market was so hot in February, it will take several months for this trend to bring us back to more normal levels. However we note that Buckeye has broken below 200 and only one city (Avondale) is still over 500.
We anticipate that all of the CMIs in the table will drop sharply over the next 4 weeks. Beyond that, it is anybody's guess.
May 4 - The initial estimates for April in Maricopa based on Affidavits of Value are as follows:
Overall sales were down 13% compared to April 2021
New home sales were down 15% while re-sales were down 13%
The overall median sales price was $479,422, up 27.5% from $376,000 in April 2021
The new home median was $496,431, up 25.5% from $395,452 in April 2021
The re-sale median was $475,000, up 26.7% from $375,000 in April 2021
The typical home in Maricopa County rose $100,000 over the last 12 months.
These figures are for single-family homes and townhouse / condos combined, though the market is still overwhelmingly dominated by single-family detached homes.
May 3 - The supply situation has changed a lot in percentage terms since the beginning of April. Although the number of active listings remains low by long term standards, a few segments of the market have seen buyers suddenly faced with almost twice as many homes to choose from.
Here is how it varies by price range for single-family detached homes:
Homes under $400,000 have increased from 638 to 644 (+1%)
Homes between $400,000 and $500,000 have increased from 874 to 1,118 (+28%)
Homes between $500,000 and $600,000 have increased from 586 to 878 (+50%)
Homes between $600,000 and $800,000 have increased from 632 to 893 (+41%)
Homes between $800,000 and $1,000,000 have increased from 312 to 431 (+38%)
Homes between $1 million and £1.5 million have increased from 268 to 364 (+36%)
Homes between $1.5 million and $2 million have increased from 92 to 171 (+86%)
Homes between $2 million and $3 million have increased from 90 to 151 (+68%)
Homes over $3 million have increased from 234 to 254 (+9%)
These numbers are for active listings without a contract. That is, they exclude UCB and CCBS active listings.
We can see it is the price range from $1.5 million up to $3 million that has experienced the largest increase.
It is unusual to see such large percentage increases and extremely unusual for them to occur during April.
May 2 - Cromford® Public subscribers who glance at chart TA12 or TA13 will notice that an unusual "city" has knocked Scottsdale into third place for annual average price per square foot. While Paradise Valley remains at number one, Tortilla Flat 85190 makes number two for the first time.
The average of $545.98 per sq. ft. was achieved in 2021 for a single-family home of 1,566 sq ft. set on 20 acres near Mud Spring Canyon within the Tonto National Forest. And yes this remote spot is within Maricopa County. It was first marketed in 2015 for $1,350,000 and failed to sell after 2 years. It finally changed hands for $550,000 in 2020 which seems like bargain for anyone who likes wonderful desert views, horses, boats and getting away from it all. Apache Lake is only 2 miles away.
It was resold in 2021 for $855,000, putting it high up our $/SF table. These transaction did not involve ARMLS, so they are not visible in the main Cromford® Report data..
The strangest thing about its location is that, although it is within Tortilla Flat AZ 85190 from the USPS point of view, you cannot easily visit Tortilla Flat by vehicle along AZ highway 88 because that road has been closed since 2019 due to storm damage following the Woodbury Fire. To get from this home to its local postal counter would take a round trip of 220 miles lasting about 5 hours and 30 minutes. That must be some kind of record I think.
Parts of the Wild West are still very wild.
For pictures of the property see 2015 MLS listing 5358916.
May 1 - Supply has been arriving in greater quantities over the past few weeks, This applies to both rental and for-sale listings.
The most dramatic rises are in rentals. There were 2,550 new rental listings created in the last 4 weeks, which is up 45% from the same 4 weeks of 2021. For 2022 year-to-date we have seen 26% more new listings (10,072 versus 7,995).
Residential for-sale listings added over the last 28 days number 10,476, up from 10,387 in the same period of 2021, a 0.9% increase. Year to date we have seen 40,198, down from 40,580 last year.
The problem for the market is that this extra supply is coming just as demand is dropping fast.
The for-sale active listing count (excluding UCB and CCBS) across all areas & types has jumped 27% in just 4 weeks. This is even faster than we experienced in April 2005. That's a scary percentage, even though the absolute numbers remain small. If this growth rate persists through May and June, the market will be very different by July.
April 30 - Although the market is cooling, prices are still on a strong upward trajectory that will be maintained for several months at least. Supply is increasing while demand is falling, but the gap is so large that it will take a long time for these two elements to achieve balance, even if the current trend continues.
The price increases over the past 2 years have been extremely large, but should not be surprising to Cromford® Report subscribers, given the very high levels reached by the Cromford® Market Index since mid-2020. They will of course be surprising to followers of the CoreLogic Monthly Home Price Insights reports, who have forecast that price increases would be very weak from mid-2020 onwards. In fact in June 2020 they told us that home prices would fall by 6.6% by June 2021. A year later in June 2021, they projected that prices would rise by 3.2% by June 2022. It is hard to imagine anyone being more consistently inaccurate in forecasting home prices.
Here is what has actually happened over the past 2 years: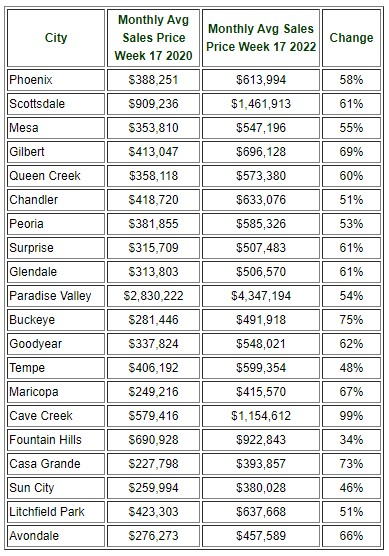
The averages are for single-family detached homes only. The cities are listed in order by total dollar volume.
April 28 - Here is our latest table of Cromford® Market Index values for the single-family markets in the 17 largest cities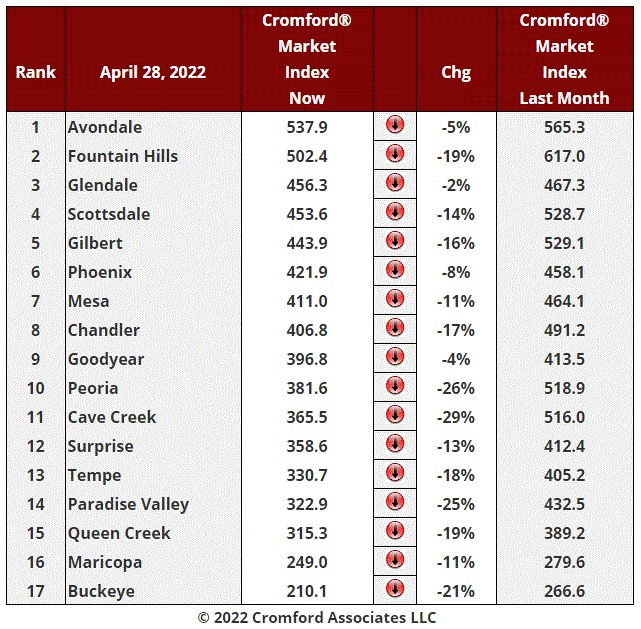
Even Glendale has now capitulated and market conditions deteriorated for sellers across all 17 cities during the last month.
The average decline was -15.3% which compares with -12.6 last week. The largest declines in CMI occurred in Cave Creek, Peoria, Paradise Valley and Buckeye.
The trend is now well established and accelerating. Demand has weakened considerably and is now well below normal in several important locations. See the Cromford® Demand Index for major cities to see more detail. Supply remains far below normal but is rising. Supply is increasing fastest in what is now the mid-range - $500,000 to £1,000,000.
Cheaper homes that are still in demand from large-scale investors remain hard to find. The luxury market is also under-supplied but supply is creeping higher here too.
April 27 - The permit counts have been published by the Census Bureau for March 2022. The Maricopa and Pinal county single-family count for March was 3,841. This is a massive total suggesting that supply of new single-family homes will be increased in coming months. It is the largest total since May 2006.
Ranked the number of dwelling units, here are the top 10 cities:
1. Phoenix 463
2. Avondale 417
3. Unincorporated Maricopa County 392
4. Unincorporated Pinal County 387
5. Surprise 349
6. Buckeye 343
7. Queen Creek 221
8. Mesa 211
9. Goodyear 202
10. Maricopa 170
It is interesting to note that almost 800 homes are to be built in areas that are unincorporated.
It is also fascinating to see how few homes are being built in large established cities that until a few years ago were major centers for home construction. These include Chandler (38), Gilbert (114), Scottsdale (85), Peoria (61), Glendale (35) and Tempe (13).
April 26 - The latest S&P / Case-Shiller® Home Price Index® numbers were published on April 26.
The new report covers home sales during the period December 2021 to February 2022. So they do not reflect sale since March 1, 2022.
Comparing with the previous month's series we see the following changes:
1. San Diego +4.47%
2. Seattle +4.38%
3. San Francisco +3.70%
4. Los Angeles +3.20%
5. Denver +3.08%
6. Dallas +2.90%
7. Tampa +2.65%
8. Portland +2.53%
9. Miami +2.30%
10. Phoenix +2.24%
11. Boston +2.09%
12. Las Vegas +2.08%
13. Atlanta +1.99%
14. Charlotte +1.91%
15. Washington +1.68%
16. Detroit +1.61%
17. Chicago +1.20%
18. New York +1.11%
19. Minneapolis +1.08%
20. Cleveland +0.87%
Phoenix has dropped another 2 places to tenth place but remains above the national average, which was 1.73%. The top of this month-to-month table was dominated by the west coast. The north and east are seeing the weakest home price appreciation.
Comparing year of year, we see the following changes:
1. Phoenix +32.9%
2. Tampa +32.6%
3. Miami +29.7%
4. San Diego +29.1%
5. Dallas +28.8%
6. Las Vegas +27.5%
7. Seattle +26.6%
8. Charlotte +25.5%
9. Atlanta +24.0%
10. San Francisco +22.9%
11. Denver +22.3%
12. Los Angeles +22.1%
13. Portland +19.0%
14. Detroit +14.6%
15. Boston +14.6%
16. Cleveland +13.6%
17. Chicago +13.1%
18. New York +12.9%
19. Minneapolis +12.0%
20. Washington +11.9%
Phoenix is top of the year-over-year table for the 33rd consecutive month.
The national average was 19.8%, up from 19.2% last month.
April 24 - Red flag warning. The housing market is changing more rapidly with rising supply and falling demand. While it remains far above normal for now, the Cromford® Market Index is dropping fast.
Here is an image extracted from the weekly CMI chart: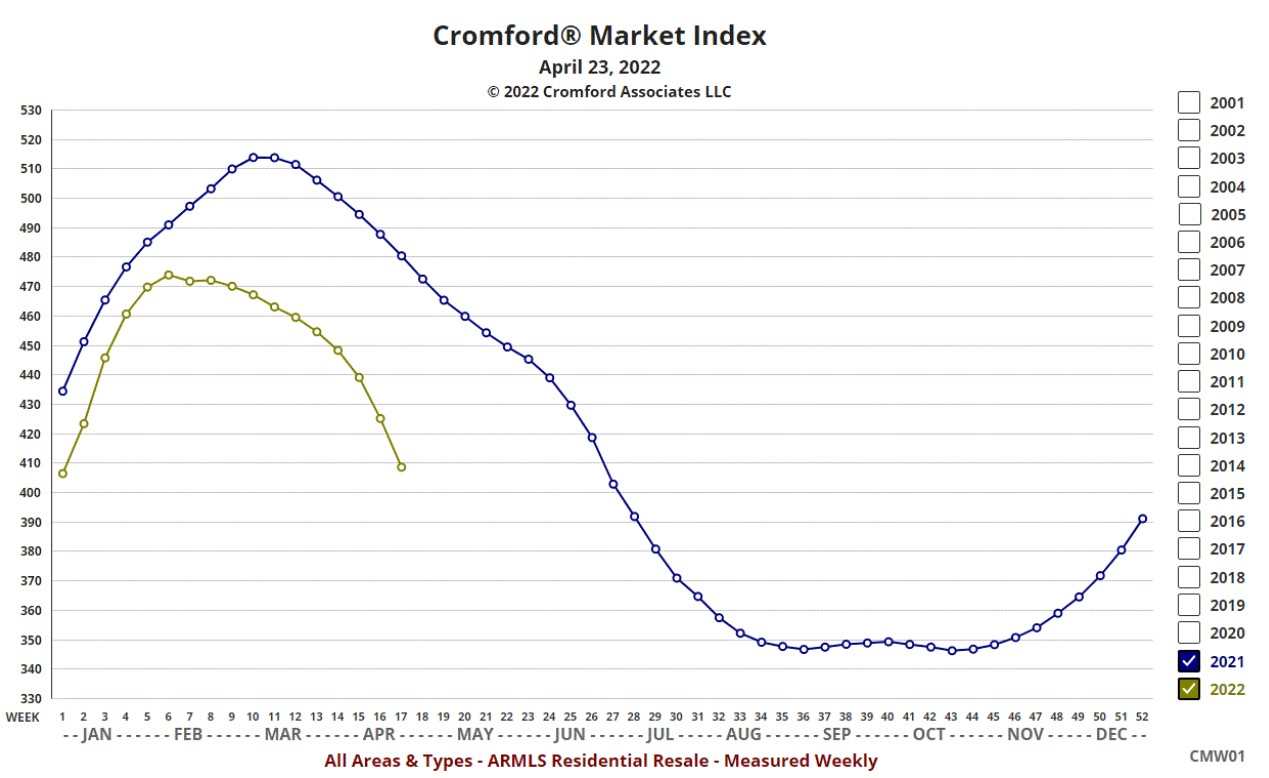
We can clearly see that the CMI is accelerating downwards. Although it remains above 400, representing a very hot market, the downward trend is so powerful it appears possible that it will drop below 300 within a matter a weeks rather than months. It is not possible to predict the CMI, as it is designed to be the very earliest indicator of market changes. We do not know when this decline will bottom out.
Last year we saw a similar but less intense fall during June. However, investors and iBuyers filled the gap left by the fading owner-occupier demand and kept inventory at low levels. The CMI bottomed out well above 340 and staged a second rally.
April is supposed to be one of the best months for the market, but new contract signings are significantly lower than last year. This means active listings are staying active longer and inventory is starting to build in most (but not all) segments. At the moment the number of homes for sale remains very far below normal, but we have seen before how it can increase sharply if more sellers emerge just as demand is declining.
There are a sequence of market indicators that fall like dominoes when a major change occurs in the market. The CMI is specifically designed to be the first of those dominoes. We will be reporting on the state of those confirming indicators over the course of the next few weeks and we advise subscribers to pay close attention. Do not pay attention to prices. They will continue to rise for many months, since they are trailing indicators of market conditions.
This is probably one of those important times when early action may be required. If you are over-extended in your real estate investments, I advise a large increase in caution right now.
April 23 - During Thursday and Friday we saw the strongest rate of incoming new listings for a very long time. Over the last 4 weeks a total of 10,059 new listings were added to the ARMLS database, the first time we have seen a total over 10,000 since September. With listings going under contract more slowly, we could see inventory start to recover over the next few weeks.
Cities with more single-family homes available include:
Phoenix (highest since January 22)
Mesa (highest since January 30)
Scottsdale (highest since December 15)
Peoria (highest since January 17)
Queen Creek (highest since January 9)
Maricopa (highest since February 13)
Buckeye (highest since December 5)
Cave Creek (highest since November 7)
Fountain Hills (highest since November 17)
Avondale continues to struggle with low inventory.
Since we are in the middle of the spring buying season, this is a positive sign for buyers. More choice and less competition from other buyers.
April 22 - Comparing today with April 22, 2021 for active rental listings on ARMLS:
Singe-family detached rentals have grown from 728 to 1,561 - a 114% increase
Townhomes are up 45%
Apartment-style homes are down 12%
That is a large shift in the mixture, with apartments harder to find but a dramatic increase in the number of single-family detached homes available to rent - the most since April 2020.
The average rent being asked for single-family detached homes is down again to $1.63 per sq. ft. per month. It was $2.03 this time last year. So not only do prospective SFD tenants have more than twice as many ARMLS listings to choose from, they are on average being asked to pay 20% less in rent per square foot.
Yet, almost everybody is saying rents are going up. Not in Phoenix they're not.
With rents going down and mortgage rates and home purchase prices going up, the argument for buying over renting is starting to look significantly weaker.
April 21 - Here is our latest table of Cromford® Market Index values for the single-family markets in the 17 largest cities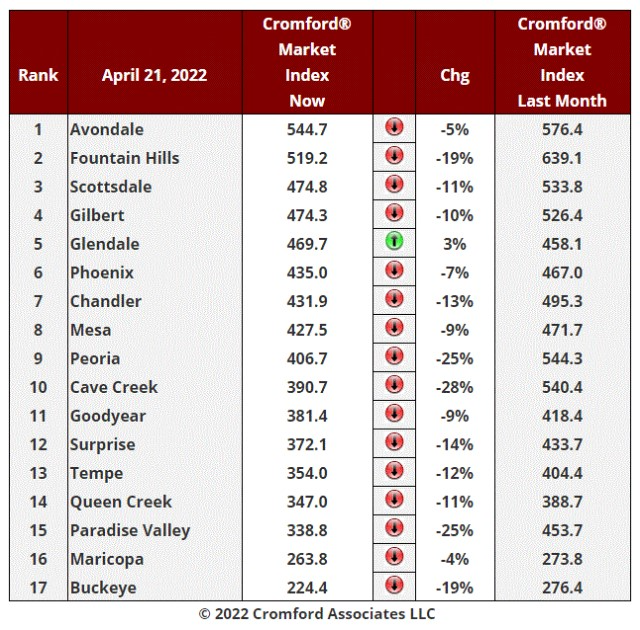
Glendale is now the only holdout where market conditions improved for sellers over the last month. The other 16 cities saw conditions improve for buyers, many dramatically so. Cave Creek, Peoria and Paradise Valley saw their CMI drop by 25% or more, while Fountain Hills and Buckeye fell 19%.
We have not seen such a precipitous drop in the CMI since the second quarter of last year.
However, this does not mean the market is cool. In Phoenix, for example, the reading of 435 means there are more than 4 buyers for every home available for sale. Even in Buckeye, the bottom ranked city, there are more than 2 buyers for every home available for sale.
For prices to go down, we need to have more sellers than buyers. If we had twice the number of homes for sale and half the current demand, conditions would be right for a balanced market. A cursory glance tells us that situation is still a long way away.
Where would double the supply come from? Not from existing normal owner-occupiers, who would probably need to find a replacement home for the one they are selling and would be unimpressed by the prospect of exchanging their current mortgage for a much more expensive one. Both demand and supply are likely to keep trending down from these normal home-owners.
The most likely source of more homes for sale would be investors who have lost the desire to hold onto their investments. If they cannot find a tenant, then their asset has significant holding costs (HOA fees, property taxes, maintenance, utilities, etc.) that they could do without. Although finding a landlord with a long-term empty property has been difficult over the past several years, it is not so hard to imagine this at some point in the future.
This is why we are advising our subscribers to keep an eye on rental supply and rental rates. Look out especially for signs of landlord distress. First month rent-free, rent price cuts and other creative incentives offered to tenants are signs that all is not well in landlord-land.
If this scenario does NOT come to pass then all we are seeing is the gradually cooling of an overly-hot market with the softest of soft landings. Prices will continue to climb in these conditions, though at rates closer to overall inflation. This is still a pretty high rate because inflation appears to be out of control right now.
If it does come to pass, it is conceivable that there is a race to exit the market by the financially-weakest landlords and those with the least appetite for risk. In these circumstances we would see a growing inventory of homes to rent, followed by a growing inventory of those same homes for sale.
April 19 - As if responding to yesterday's observation, today we have over 1,000 Coming Soon listings for the first time. Supply is beginning to grow at last and nowhere more than in the single-family detached rental market. Over the past 4 weeks, we have seen a 34% increase in the number of new rental listings added to ARMLS compared with the same 4 weeks in 2021.
There has also been a 20% increase in the number of rental homes available in Phoenix on the Progress Residential website over the past 4 weeks.
Renters of single-family detached homes are seeing far more choice than they did last year and we are starting to see homes advertised with "the first month's rent is free". Rental supply is particularly strong in Gilbert.
This appears to be a significant turnaround in the rental market and it does not seem to have been recognized by the media outlets, who are mostly still referring to rising rents. That is so 2021.
April 18 - The Easter weekend usually sees a slight lull in new listings and we are experiencing the usual short-term effect in 2022. One number that is still increasing is the number of listings "coming soon". The average count this week is 919, up from 805 this time last year. We hit a low of 441 in the third week of December, but have witnessed strong growth since then.
As supply slowly starts to recover, we anticipate we will see "coming soon" counts increase until the market softens enough to make "coming soon" a less popular option with agents. We are some considerable way from that point at the moment as the increase in supply is still very moderate
April 2022 Phoenix Metro Market Report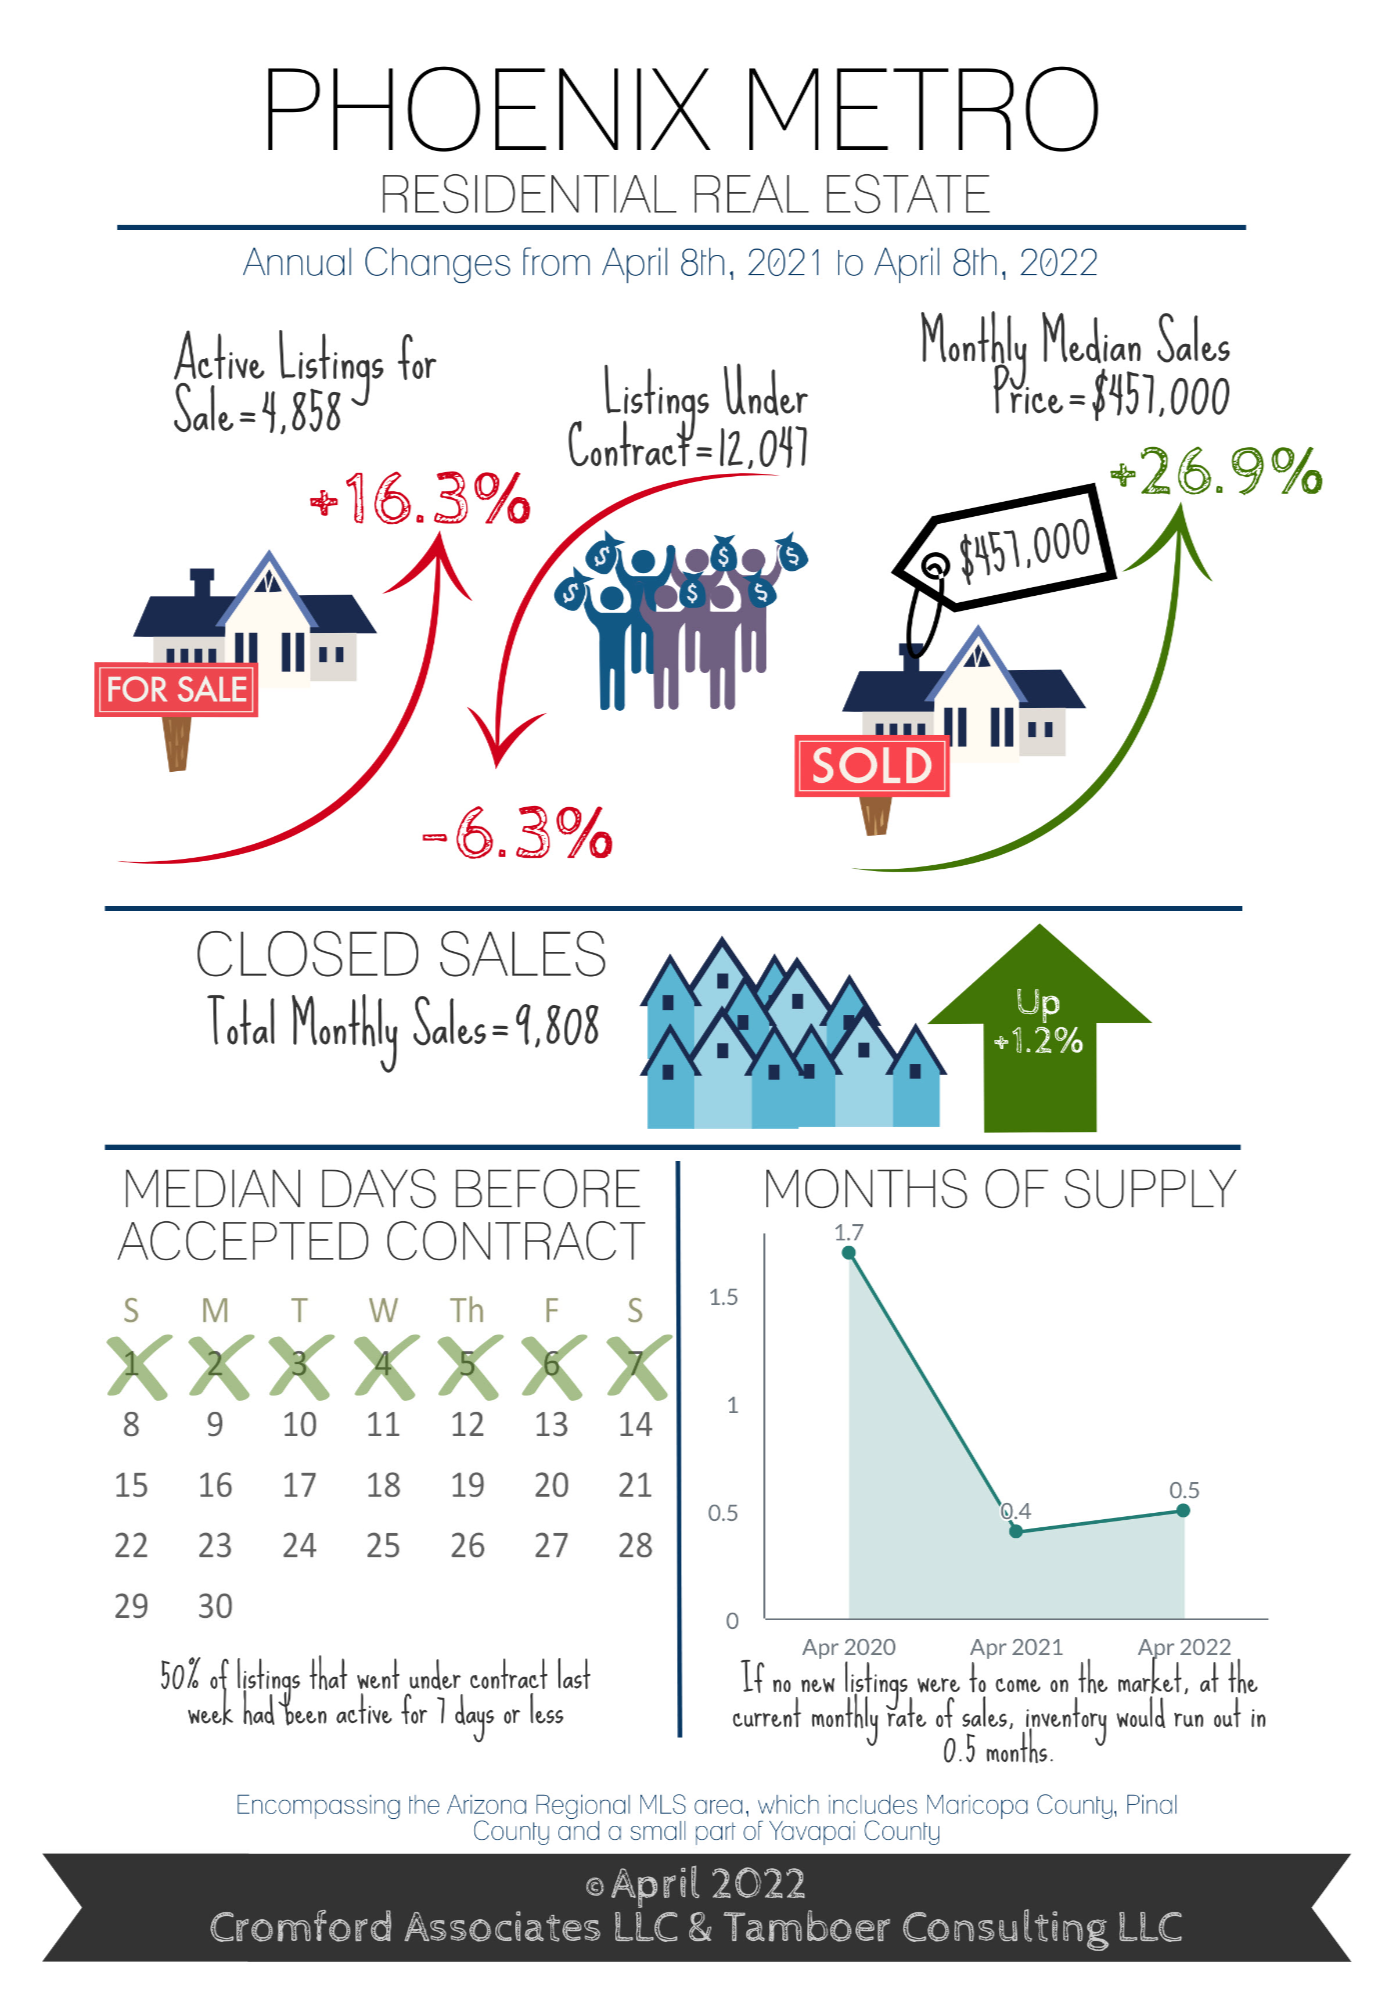
57% of Sales are Over Asking Price
Median Sale Price Up 27% to $457,000
For Buyers:
Supply is still the top concern for buyers these days and we continue to look to new construction to add new homes and ease the pressure on price. The top areas for new single family home sales are the West Valley, with 44% market share, and Pinal County, with 27% market share. The Southeast Valley comes in 3rd with 17%. If you’re looking to the West Valley for a new home, your best bets are Laveen, just east of the new 202 freeway loop, and cities just west of the 303 freeway such as Peoria, Surprise, Waddell, Goodyear and Buckeye. In the Southeast Valley, new home subdivisions are concentrated in East Mesa, Queen Creek, South Gilbert and South Chandler. In Pinal County, Casa Grande and Maricopa have the most new home sales.
As of February 2022, the median cost of a new home closed was $447,000 overall with a median size of 2,197 sq. ft. That was just under the resale median of $450,000 in the same month, which had a median size of 1,783 sq. ft. In the West Valley, the new home median is $443,000 with 2,237 sq. ft. In the Southeast Valley that median is $579,000 and 2,456 sq. ft., and in Pinal County it is $385,000 with 1,888 sq. ft.
New home developers continue to struggle with a labor shortage and supply chain issues. It’s not uncommon for builders to estimate 14-16 months before completion of a home. Because prices have been rising sharply, this means that by the time a home is built, the costs to complete it have gone up and it’s already worth significantly more than the negotiated purchase price. For this reason, some builders are including escalation clauses in their contracts that allow them to raise the price prior to close of escrow to accommodate the higher costs to build and closer reflect the current market value. In addition to escalation clauses, a handful of builders are including restrictions on when a homeowner can sell or rent the home after close. It’s important to read builder contracts closely and ensure you understand every section before moving forward.
For Sellers:
The market continues to heavily favor sellers. Supply is still 76% below normal for this time of year and demand is 6% above normal. However, demand is declining in response to recent increases in interest rates. Just 30 days ago, demand was 12% above normal, and 30 days prior to that it was 21% above normal. Buyers across the nation are in the best financial shape seen in decades with an average credit score of 714 last year, according to Experian, and Maricopa County has the lowest percentage of consumers with credit scores below 660 in at least 22 years. However, in just a few short months, the average interest rate increased from 3.1% in December to 4.7% by April. This resulted in a $500 increase in the estimated payment on a 1,500-2,000 sq. ft. home, pushing the cost to buy significantly higher than the cost to rent in Greater Phoenix.
This does not mean the market is at its peak, or at the precipice of a price decline. The only response we are seeing at this time is a sharp increase in supply between $500K-$1M over the past 2 weeks, a price range that happens to have less interest from investors and 2nd home owners and a higher market share of owner-occupants. Despite this increase in supply, the median days on market prior to contract is still only 7 days, and there aren’t any bold movements in price reductions or seller concessions. Until we see an upward shift in price reductions and seller concessions, we will not see a flattening out or decline in sale prices.
Currently, April closings to date have seen 57% of closings over asking price and a 22% appreciation rate compared to April 2021 thus far. While it’s reasonable to expect price appreciation to slow down at some point, there is little evidence at this stage to show prices declining in the near future.
April 14 - Here is our latest table of Cromford® Market Index values for the single-family markets in the 17 largest cities

Over the last month, 2 of the 17 cities have improved for sellers while 15 have deteriorated. The market strongly favors sellers, but the trend is now moving slowly towards a more balanced market. The average change in the CMI over the past month is -9.5% whereas it was -6.4% last week. The cooling of the market continues to accelerate, but it will take several months before reaching normal at the current rate of change.
April 13 - Looking at how the rental inventory has changed over the past year, we see that:
single-family detached actives have increased by 99%
apartment actives have increased by 69%
townhouse actives have increased by 15%
It is clear that single-family rentals are in much greater supply in 2022 and now comprise 71% of rental listings. At the same point in 2021 they were only 51% of rental listings.
This goes some way to explaining part of the drop in average rents between 2021 and 2022. The average asking price for a single-family detached rental is currently $1.61 per sq. ft. per month. It was $1,97 this time last year having peaked at $2.09 at the end of March 2021.
For apartments the current average asking price is $2.16 per sq. ft. per month' having been $2.04 this time last year.
For all types of condos (townhomes and apartments), the average asking price is currently $2.02 per sq. ft. per month. It was $1.90 this time last year.
So the drop in rental prices is NOT happening to townhomes, in fact they have been increasing. They also remain in short supply. Apartment rents have also increased but supply is much better than a year ago.
The big changes are in single-family rentals where supply has doubled over twelve months and the average rent asked has declined by 18%.
April 11 - Supply is starting to creep up again. Scottsdale has more than 400 active single-family listings (not counting UCB or CCBS) for the first time this year.
Buckeye is over 180 for the first time since January
Chandler is over 160 for the first time January.
The change is still gradual but the trend is slowly building.
April 10 - March had 23 working days, whereas February only had 19. This means the sale count needed to increase by 21.1% just to stand still. In Maricopa County, closed homes grew by 25.4% so they did better than standing still. However this does not compare favorably with the 28.8% growth we saw between February and March 2021.
The main geographic area that under-performed was the Central and North Valley which only gave us 20% growth. The Northeast grew 25.9% while the West grew 27.4% and the Southeast grew 28.1%.
The only area to see sales grow year over year was the West Valley which was up 0.7%
The Northeast Valley under-performed compared to March 2021 with sales down 20.2%.
The change in the mix in favor of the west and against the northeast led to a significant decline in the average home size compared to a year ago. It also lowered the average and median price measurements, but they were up so dramatically anyway that almost nobody could notice this effect.
April 9 - The luxury market has been on a frantic run in the last 12 months with remarkable increases in price during that period. For example:
The annual average $/SF has increased from $472 to $631 in Paradise Valley - a rise of 34%
The annual average $/SF has increased from $459 to $600 in Arcadia - a rise of 31%
The annual average $/SF has increased from $361 to $461 in the Biltmore District - a rise of 28%
The annual average $/SF has increased from $348 to $452 in North Scottsdale - a rise of 30%
There still appears to be a great of momentum in the same direction and we expect these annual averages to continue to rise throughout 2022. We say this because the 3-month average $/SF is already much higher than the annual average, at $713 in Paradise Valley, $651 in Arcadia, $504 in the Biltmore District and $506 in North Scottsdale.
April 7 - Here is our latest table of Cromford® Market Index values for the single-family markets in the 17 largest cities
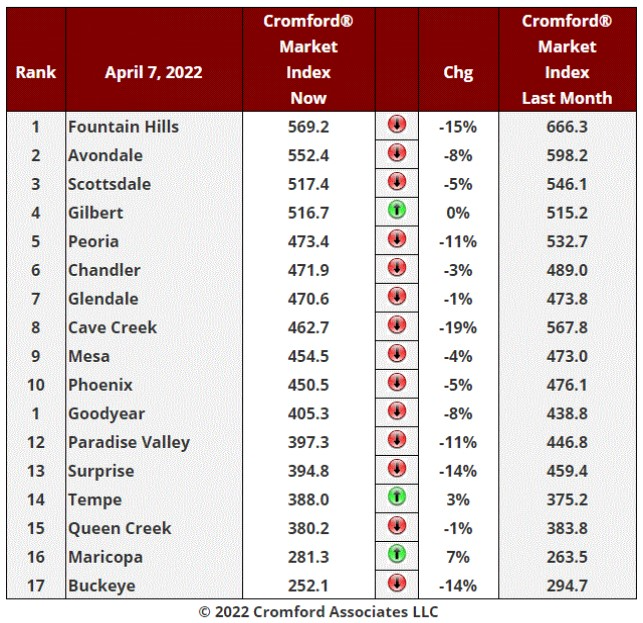
Over the last month, 3 of the 17 cities have improved for sellers while 14 have deteriorated. Although we still have a market that strongly favors sellers, the trend is now towards a more balanced market. The average change in the CMI over the past month is -6.4% whereas it was -3.2% last week. The cooling of the market has accelerated, but it remains extremely hot compared to normal.
Cave Creek moved lower the most, followed by Fountain Hills, Surprise and Buckeye. Maricopa and Tempe were the only two cities that moved significantly higher.
April 6 - New rental listings are arriving thick and fast now. The count over the past 4 weeks is 31% higher than at this time last year. However they are getting leases signed pretty quickly and the number of active listings is only 0.6% higher than this time last month. What should be more concerning for landlords is:
active listings are up 44% from this time last year
the average lease price per sq. ft. being asked has dropped from $1.80 to $1.69 over the last month, a fall of 6%
the average lease price per sq. ft. being asked was $1.99 this time last year, so it has fallen 15% in 12 months
These are starting to look like significant changes of direction. The supply of rentals had been falling until August 2021 and the asking rent had been rising for many years until it peaked at $2.03 just over a year ago.
April 5 - The affidavit of value data from Maricopa County has been compiled for March (though not fully validated) and shows us this:
There were 11,382 closed sales recorded during March 2022, down 5% from March 2021
There were 1,558 new homes closed, down 11% compared to March 2021
There were 9,824 re-sale closings, down 4% from March 2021
The median sales price was $470,000, up 29% from $365,000 in March 2021
The new home median sales price was $497,027, up 27% from $391,640 in March 2021
The re-sale median home price was $465,000, up 29% from $360,000 in March 2021
The above numbers include single-family and condo/townhouse properties. Many affidavits were missing because Zillow is still claiming an invalid B7 exemption from filing affidavits for homes sold in bulk to investors. Exemption B7 would only apply if the investors were subsidiaries of Zillow and the homes were sold for no or negligible consideration. Opendoor is also lowering the quality of affidavit data by recording many of its sales as cash transactions when they were manifestly financed. The quality of title work done for these 2 iBuyers sometimes leaves a lot to be desired. This limits the accuracy we can achieve in compiling sales statistics, especially regarding sales prices and finance types. We try to get this data corrected, but it takes extra time and means the initial readings are less accurate than we would like.
April 4 - The homes sold through ARMLS in March had an average price of $517,774. The equivalent figure for February was $507,518 while that for March 2021 was $413,957 and for March 2020 was $353,017.
This means if you owned an average home in the ARMLS area, it gained more than $10,000 in asset value during a single month. When people ask why it is better to own than rent, here is one data point they might consider. And it is not just a single month that pops out. The gain over the last year was $103,817. The average home made more money than the average working family. On top of that, gains in home value are not taxable if it is your sole residence and the gain is less than $500,000 for married taxpayers filing jointly ($250,000 for individuals). The average working family pays a significant amount of income tax, social security and Medicare from their gross income. Investors pay tax on their capital gains, but they also get to deduct 100% of any mortgage interest as well as theoretical annual depreciation (don't laugh).
Because investors can end up with their assets depreciated to very low levels, even zero, they are usually highly incented NOT to sell their assets. If they did they would have to pay capital gains tax on the entire depreciation as well as the real increase in value. It also explains why 1031 exchanges are so popular with investors. It allows them to sell without paying capital gains tax, but they stay invested in the market.
Those people who pulled out of a home purchase at the start of the COVID-19 epidemic must be kicking themselves. The average home has increased in value by $164,757 since March 2020, which is an increase of 47%. I did warn buyers in the daily observation of March 18, 2020 that if they pulled out of their purchase they would probably be making a poor decision. In the event it was much worse than that - it was a terrible decision.
The last 2 years have been atypical for the housing market and we do not expect the next 2 years to deliver the same appreciation. Vastly higher prices combine with a sharp rise in mortgage interest rates to make it impossible for an increasing number of people to qualify for the loan they would need. There is plenty of latent demand for homes, but it does not translate into actual demand if the buyers cannot qualify. We are left with demand from cash buyers, the most significant of these being investors. The general mood among cash investors in residential real estate can be realistically described as euphoric. That is troubling in itself.
One wonders how euphoric they will feel when their rents start to decline. The ARMLS database suggests rents are already on a declining trend. The average lease list price per sq. ft. was $1.69 yesterday. It was $1.98 this time last year.
The first natural response from investors will therefore be denial. Extreme caution would be a wiser approach.
April 3 - Although supply remains very low by normal standards, demand has weakened enough to allow inventory to start trending upwards. This has been really noticeable only for the last 3 days and the number of active listings in Greater Phoenix (excluding UCB and CCBS) is 13.4% higher than this time last year. This is the highest year over year increase in supply we have seen for several years.
We have been focusing on supply for the slightest indication of a break in the market's fever, and this is the most significant sign we have found. As yet it is a minor change that will be barely perceptible in the real world. But the mathematics suggest we are entering a proper cooling phase and I would be surprised if this does not become more significant as the second quarter progresses.
The trend is most noticeable at the affordable end of the market, where buyers are heavily dependent on interest rates. Below 3,000 sq. ft. inventory is up almost 22% from a year ago. Above 3,000 sq. ft. inventory is down 11% from last year. Above 5,000 sq. ft. inventory is down 43% from last year at this time.
It is important to stress that we are NOT seeing more incoming new listings; in fact they are currently arriving slower than last year. But active listings are going under contract at a decreasing pace, which means we get more choice for any buyers looking for a home, at least for homes under 3,000 sq. ft..
This is not the end of bidding wars, but it might be the start of a long drawn-out peace process.
I recommend Tableau chart AL04 if you would like to examine this phenomenon in detail.
April 2 - As statisticians, we rarely focus on individual houses, but prefer a large sample size so we can be confident our deductions are sound. However, our wise friend Tom Ruff brought our attention to one particular one-story single-family home in Desert Ridge (Phoenix 85050) with a very interesting history.
Originally built in 1998 by Shea Homes and sold that year for $189,468, it has had 10 owners since that date, its most recent sale being for $707,500 in 2021.
The most interesting sales were the last 4:
Purchased by Zillow in 2019 for $512,500
Purchased by a new homeowner in 2020 for $453,000
Purchased by Opendoor just 7 months later for $778,400
Purchased by another new homeowner in 2021 for $707,500
So the first homeowner managed to make a gross profit of $325,400 after owning the home for just 7 months. That's quite some flip.
In contrast, Zillow managed to lose $59500 (12%) on a home they owned for 10 months, while Opendoor managed to lose $70,900 (9%) on a home they owned for 4 months.
I will leave you to draw you own conclusions about this story. If you want to check out the history in more detail, Contact Us.
April 1 - There are a number of different techniques for measuring how hot the market is right now. All of them report that it is pretty toasty.
One of our favorites is the average percentage of the sales price compared with final list price. Here is a ranking of many the cities and towns within Maricopa and Pinal according to that measure at the end of the first quarter. The numbers are for single-family detached homes only: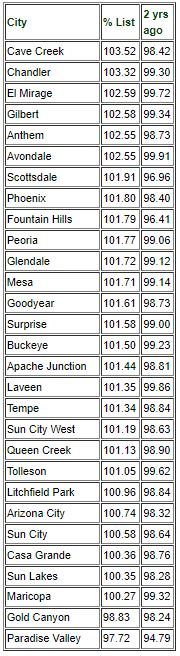
Cave Creek and Chandler are stand-outs by this measure at the moment. Scottsdale and Fountain Hills are much higher in this table than we normally see, as evidenced by the numbers from 2 years ago, as the COVID-19 pandemic started to dominate proceedings. Only Gold Canyon and Paradise Valley are still seeing their average homes sell for less than list price.
March 30 - The Cromford® Public charts covering single-family and multi-family permits have been updated to include February unit counts.
The multi-family unit count for February was a relatively modest 1,039 for Maricopa and Pinal counties. This is the lowest count since August, but these monthly counts are pretty volatile and it would be foolish to draw too much of a conclusion from a single month of data. The annual rate of 16,187 remains very high - the third highest we have recorded, exceeded only by December 2021 and January 2022.
Multi-family permits are some 60% higher than the long-term typical count of 10,000 per year.
Single-family permits for Maricopa and Pinal counties totaled 3,155 in February. This is the highest total since April 2022. However, it is not higher than the long-term typical rate since 1996. We saw a collapse in permit counts in 2008 which recovered very slowly. The lull lasted until 2020. But typical monthly rates between 1996 and 2007 were around 3,000 and they have resumed at that level since 2020.
The overall picture is that multi-family permits are well above normal while single-family permits are at a normal level.
March 29 - The latest S&P / Case-Shiller® Home Price Index® numbers were published on February 29.
The new report covers home sales during the period November 2021 to January 2022.
Comparing with the previous month's series we see the following changes:
San Diego +2.50%
San Francisco +2.35%
Tampa +2.33%
Seattle +2.02%
Dallas +1.89%
Miami +1.83%
Las Vegas +1.70%
Phoenix +1.69%
Denver +1.61%
Los Angeles +1.59%
Atlanta +1.47%
Charlotte +1.26%
Washington +1.11%
Portland +0.91%
New York +0.86%
Detroit +0.71%
Boston +0.66%
Chicago +0.64%
Minneapolis +0.50%
Cleveland +0.33%
Phoenix has dropped 2 places to eighth place but remains above the national average, which was 1.41%. No city declined month to month. Given that the market data does not include any of the Spring selling season, these are particularly strong numbers, particularly for the West and South of the country
Comparing year of year, we see the following changes:
Phoenix +32.6%
Tampa +30.8%
Miami +28.1%
Dallas +27.3%
San Diego +27.1%
Las Vegas +26.2%
Seattle +24.7%
Charlotte +24.4%
Atlanta +22.5%
San Francisco +20.9%
Denver +20.8%
Los Angeles +19.9%
Portland +17.7%
Detroit +14.0%
New York +13.5%
Cleveland +13.3%
Boston +13.3%
Chicago +12.5%
Minneapolis +11.8%
Washington +11.2%
Phoenix is top of the year-over-year table for the 32nd consecutive month.
The national average was 19.2%, up from 18.8% last month.
March 24 -
Here is our latest table of Cromford® Market Index values for the single-family markets in the 17 largest cities.
Cromford Market Index™ is a value that provides a short term forecast for the balance of the market. It is derived from the trends in pending, active and sold listings compared with historical data over the previous four years. Values below 100 indicate a buyer's market, while values above 100 indicate a seller's market. A value of 100 indicates a balanced market.
Over the last month, 8 of the 17 cities have improved for sellers while 9 have deteriorated for sellers. This is the same split as last week, but the average change in the CMI over the past month is -1.4% whereas it was +0.3% last week. Last week we said we expected today's table to show a negative percentage and we were not wrong.
The market is continuing to cool, though at a glacial pace which would take many years to reach balance.
Surprise was the weakest city, down 11% while Tempe was the strongest, up 12%.
This table confirms that pricing will continue to move higher over the next several months.
March 21 - Despite watching it for over 20 years, it still amazes me that the annual average $/SF chart is so steady and predictable. It is almost as if the market is following pure mathematical principles rather than being controlled by human decisions. Clearly each human decision to buy or sell at a given price is different, yet when we take an average over a large enough sample, each individual decision fades into almost complete irrelevance.
Looking at the weekly chart for example:
The lines look so well defined and predictable, that we can easily estimate how much the average $/SF will increase over coming months. $300 a square foot is clearly in view.
The monthly average is nowhere near so well behaved.
March 17 - Here is our latest table of Cromford® Market Index values for the single-family markets in the 17 largest cities
Cromford Market Index™ is a value that provides a short term forecast for the balance of the market. It is derived from the trends in pending, active and sold listings compared with historical data over the previous four years. Values below 100 indicate a buyer's market, while values above 100 indicate a seller's market. A value of 100 indicates a balanced market.
Over the last month, 8 of the 17 cities have improved for sellers while 9 have deteriorated for sellers. The average change in the CMI over the past month is 0.3%, down from 2.0% last week. We can expect next week's table to show a negative percentage.
Although this indicates the market is gradually cooling, it remains extremely hot and the cooling trend is about as weak as it can be without becoming no trend at all. At this pace of change it would take several years for the market to reach normality.
The top performing cities in the last month are Peoria, Tempe, Mesa and Paradise Valley, while the weakest are Goodyear, Avondale and Surprise.
We need to remind ourselves that CMIs over 110 indicate a seller's market where prices will rise faster than general inflation. Between 90 and 110, prices tend to rise in line with inflation. Below 90 home prices tend to fall or at least rise slower than inflation (which has become a significant number over the last year).
Home prices do not fall without a good reason. Few home owners want less than top price for their home. The weakest hands are always homeowners who wish they did not own the homes. In normal markets, these are banks and other lenders. However these organizations have an extremely low inventory of homes, so they are close to irrelevant at the moment.
The idea that home prices will automatically "correct" is a silly one. The housing market is not like a stock market, where the balance between supply and demand can flip several times a day. The housing market moves extremely slowly. The last time the CMI was below 110 was in January 2015 and the last it time it was below 90 was in November 2010. So the last buyer's market was more than 11 years ago. This is normal for the housing market and it is quite possible that the next buyer's market could still be many years away.
To create a situation which will force prices down, we first have to see more sellers than buyers. This is what a CMI below below 100 means. With the lowest CMI in the table above at 270.5, this is not likely for a very long time. If some of these were to drop below 150, then we might be a few quarters away from prices stabilizing. At the moment this is at least 12 months away, even in the most negative scenario we can imagine.
Sun City stands at 235.6 and is the lowest CMI we have at the moment. However the market there is looking pretty stable. With a median sales price of $350,000 it is also one of the most affordable location in central Arizona.
March 15 - During February, Maricopa County recorded 13% fewer homes purchased by owner-occupiers than in February 2021. However this was balanced by a 24% increase in homes purchased by landlords to become rentals and a 20% increase in second homes or for flipping (including iBuyer purchases).
Since owner-occupied homes are still by far the largest segment, overall sales volume dropped 3% compared with February 2021.
Sales were up 6% in the West Valley, the only area to show an increase year over year. The Northeast Valley fell sharply - down 22% from a year ago, while The Southeast Valley was down 4% and Central Valley down 1%
All these numbers are for single-family and condo/townhomes combined.
March 13 - We have just updated the city ranking table showing the annual average $/SF for 40 cities in Central Arizona.
The order of the cities does not change dramatically from year to year, with Paradise Valley consistently at the top and Coolidge at the bottom. However Paradise Valley is now well over $600 having been well under $500 just 12 months ago. Coolidge has topped $150, having been less than $110 a year ago.
The fastest appreciation over the last year has been seen in the outlying areas, such as Tonopah, Coolidge, Maricopa, Queen Creek, Arizona City and Anthem. All of these are up more than 35%. The lowest appreciation rates can be observed in Sun Lakes, Tempe and Sun City West, all below 26%, but only just.
March 12 - Despite so many observers claiming that the housing market is heading for imminent trouble, the rate at which prices are still rising is astonishing, even to seasoned old analysts like us.
The average price per sq. ft. for listings under contract just exceeded $300 for the first time. It was half that just 5 years ago.
It has risen $40 in the last 6 months - a 15% increase.
The average price per square foot for listings under contract is a leading indicator. For sales prices to stabilize, the prices for listings under contract have to stabilize first. There is a 1 to 2 month delay between the 2 measures.
There is currently no sign of price rises halting, never mind reversing.
March 10 - Here is our latest table of Cromford® Market Index values for the single-family markets in the 17 largest cities
Over the last month, 11 of the 17 cities have improved for sellers. The average change in the CMI over the past month is 2.0%, down from 3.7% last week.
6 cities have moved in favor of buyers. Fountain Hills and Maricopa have joined that list. but Tempe has left it.
Mesa and Peoria saw the strongest moves in favor of sellers while Avondale and Goodyear had the strongest moves in favor of buyers.
The market is still heavily favoring sellers, with the lowest CMI in the table at 265.3. The trend is for demand to fade very slowly while supply is stable and remains extremely low. The rate of change is currently very slow.
March 9 - We have taken a look at total dollar volume for January 2022 and compared it with January 2021, using chart DV13 from Cromford® Public.
* Dollar volume was up 19% from $4,089M to $4,852M - all thanks to higher prices, since unit volume was almost the same
* New home dollar volume was up only 3% from $711M to $732M due to lower unit volume
* Normal MLS dollar volume was up only 7% from $2.668M to $2,854M
* Normal non-MLS dollar volume was up 40% from $431M to $603M
* Investor flip dollar volume was up 154% from $250M to $635M
* Distressed sale dollar volume was flat at $28M
iBuyers tend to have a normal non-MLS purchase followed by an investor flip, so the rise in these numbers is partially due to the ramp up in transactions from iBuyers.
There is also clear evidence that more transactions are happening without hitting the MLS. This reflects high levels of investor activity.
March 5 - Although the re-sale and new homes markets continue to show very little sign of weakness, the same cannot be said of the rental market.
The vast majority of rentals do not hit the MLS, so we have to be careful because of the poor sample size. However the ARMLS rentals database shows us that the market is nowhere near as favorable to landlords as it was this time last year. Here is why we say that:
* Available supply is up from 1,543 to 2,138 units, a rise of 39%, meaning tenants are getting more choice
* New rental listings are up 20% year to date compared with 2021, so supply is arriving faster
* New rental listings are up 26% over the past 4 weeks, compared with 2021, telling us that the increased supply trend is strengthening
* The average lease list price per sq. ft. is $1.80, down from $1.93 this time last year
* The average lease list price per sq. ft. peaked at $2.01 on May 22, 2021, fell back then peaked again at $2.00 on Jul 29 before falling again - it is unable to convincingly break the $2 resistance level and has made no attempt to do so in the last 7 months
These conditions suggest that the era of quickly rising rents in Greater Phoenix may be coming to an end. A large amount of new rental supply is coming on board this year, judging by the number of multi-family permits issued in the last 2 years. Rent looks likely to stay fairly flat, which will change the buy versus rent equation as home prices and mortgage rates continue to increase. In the longer term, this could seriously dampen demand for homes to buy.
Interestingly, the supply of active listings varies a lot by dwelling type.
* apartments to rent are down 33%
* townhouses to rent are up just 1%
* single-family detached homes to rent are up 99% - there are 1,546 versus only 777 this time last year.
We are seeing single-family subdivisions under construction intended to be 100% rentals. There are many examples, and not just here in Arizona, but a typical one is Malone Place Parke (MCR 1561-18) in Queen Creek. American Homes 4 Rent has created their own homebuilding subsidiaries. There are 97 single-family homes going up here which will not have affidavits of value since they will be eligible to claim a genuine B7 affidavit exemption. The opportunity to grumble again about Zillow's misuse of the B7 is hereby declined. The investors in these projects should keep in mind that demand is not infinite.
The most likely source of more supply of single-family homes to buy is if landlords tire of owning them. This could be because they have trouble finding tenants for them or they facing declining rental incomes. A house that has no rent coming in becomes a serious problem for its owner who remains liable for the property taxes, maintenance, HOA dues, etc.. Landlords will then compete with each other for tenants and rents will start to drop. Some landlords will drop out and sell their investments.
This is likely to be a slow moving trend in the market but it should be easy to detect, as long as you are watching the correct numbers. US birth rates are very low by historic standards and with the baby boomers reaching advanced ages, we can expect natural growth in the population to be small, or even negative. Population growth will be entirely dependent on incoming transfers from other states or foreign countries. Ivy Zelman has been bearish on the housing market for a couple of years, primarily because of these demographic trends. She has been completely wrong about the market so far, but she is right that the demographics are fundamentally unfavorable for housing in the longer term. In Arizona we are atypical in that so many people have been moving here. This hides the weak natural growth in population (births minus deaths) and has driven our prices up faster than almost any other part of the USA. This will not last forever.
In Arizona, we have a history of building more and more homes until there is a very obvious reason to stop. There will come a time, and nobody knows exactly when it will be, when we have built enough shelter for the population and demand sinks below supply. I seems likely that we will see that in rentals before we see it in homes for purchase.
March 4 - The data from Maricopa County affidavits of value is now available for February, although bulk sales by Zillow are almost completely excluded because of their decision to claim an inappropriate exemption from filing affidavits. So far there does not seem to be any government (county assessor or recorder) effort to challenge that spurious claim. This means our records are much less complete than normal, so this should be borne in mind when reading further.
* There were 9,073 closed units during February, down 3% from February 2021
* New build closings numbered 1,269, down 14% from February 2021 - the new home market is closing fewer units than 2020 or 2021, but dollar volume is higher
* Re-sale closings were 7,804, down 1% from February 2021 - it would have shown growth if Zillow bulk sales had been possible to include
* The overall median sales price was $455,000, up 27% from $359,100 in February 2021 - it is up 5% in 2 months.
* The new home median was $477,741 - up 26% over the past 12 months and up 7% in the last 2 months
* The re-sale median was $450,000, up 28% over February 2021
The new home unit counts are disappointing those who would like to see more supply, but there continue to be a lot of home construction that is held up because of material shortages or limited access to skilled labor. There is also a shift in favor of Pinal County which is not included in these number because data from Pinal comes to us more slowly than Maricopa.
Increases in new home prices were lagging behind re-sales for much of 2021 but have been catching up in 2022.
All the figures above relate to single-family and townhouse/condo properties combined.